Open Access
Fig. 8
Download original image
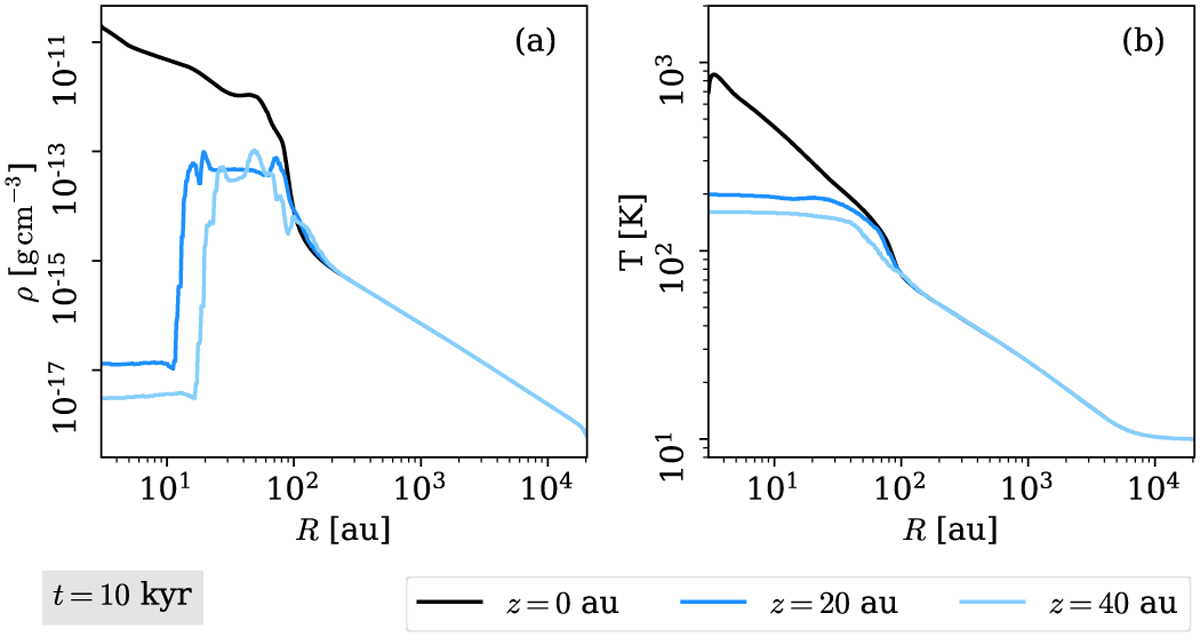
Density (panel a) and temperature (panel b) for two different altitudes in the thick layers of the disk (blue lines), and the corresponding profile for the thin layer (black). The data corresponds to the fiducial simulation on grid ×8.
Current usage metrics show cumulative count of Article Views (full-text article views including HTML views, PDF and ePub downloads, according to the available data) and Abstracts Views on Vision4Press platform.
Data correspond to usage on the plateform after 2015. The current usage metrics is available 48-96 hours after online publication and is updated daily on week days.
Initial download of the metrics may take a while.