Fig. 6
Download original image
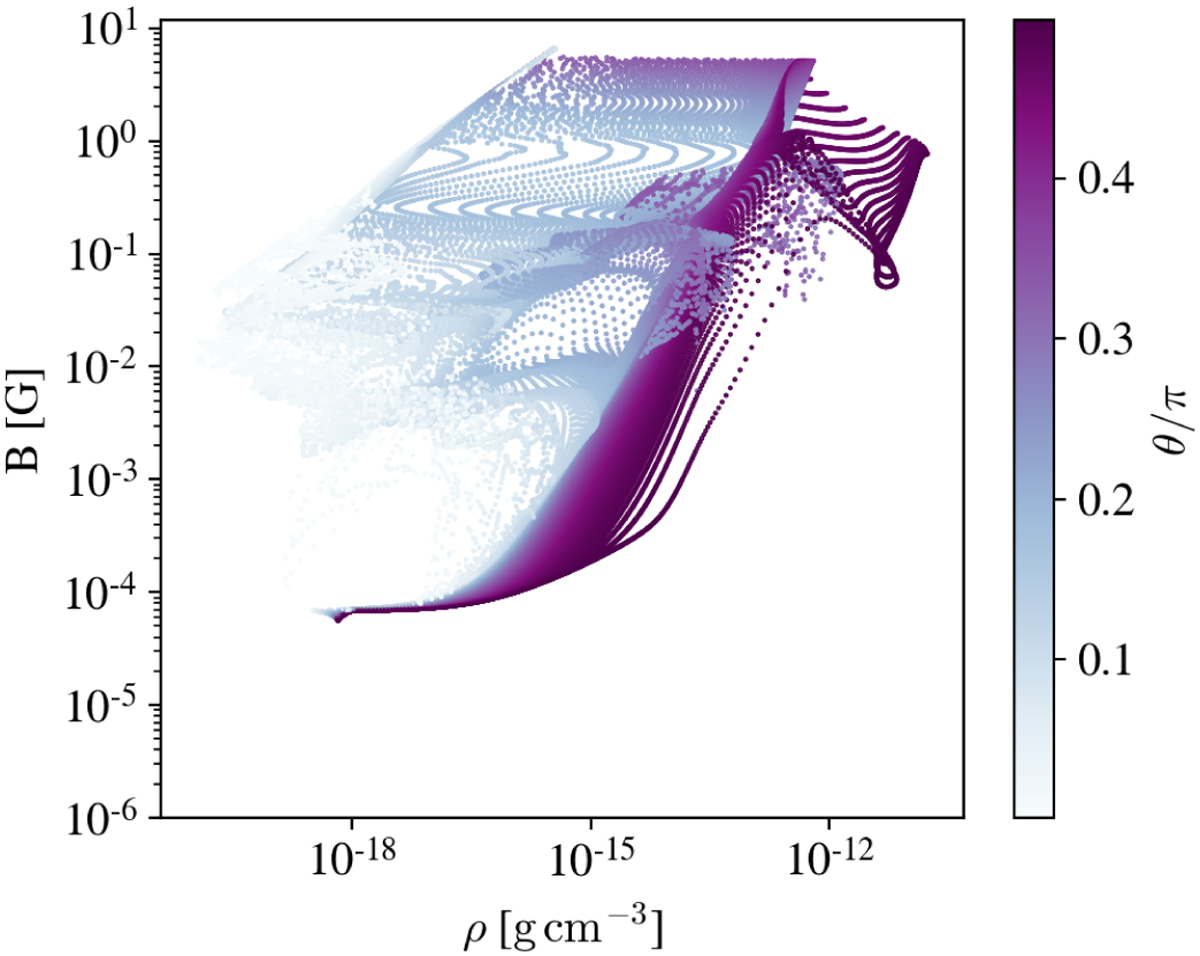
Distribution of the magnetic field strength as a function of density. This histogram was computed with the fiducial simulation run on grid ×16, for time t = 7 kyr. The color scale indicates the polar angle: the dark purple colors correspond to the midplane (with the disk corresponding to ρ ≳ 10−15 g cm−3) and the light blue colors correspond to the rotation axis (where the jet is located).
Current usage metrics show cumulative count of Article Views (full-text article views including HTML views, PDF and ePub downloads, according to the available data) and Abstracts Views on Vision4Press platform.
Data correspond to usage on the plateform after 2015. The current usage metrics is available 48-96 hours after online publication and is updated daily on week days.
Initial download of the metrics may take a while.