Open Access
Fig. 8
Download original image
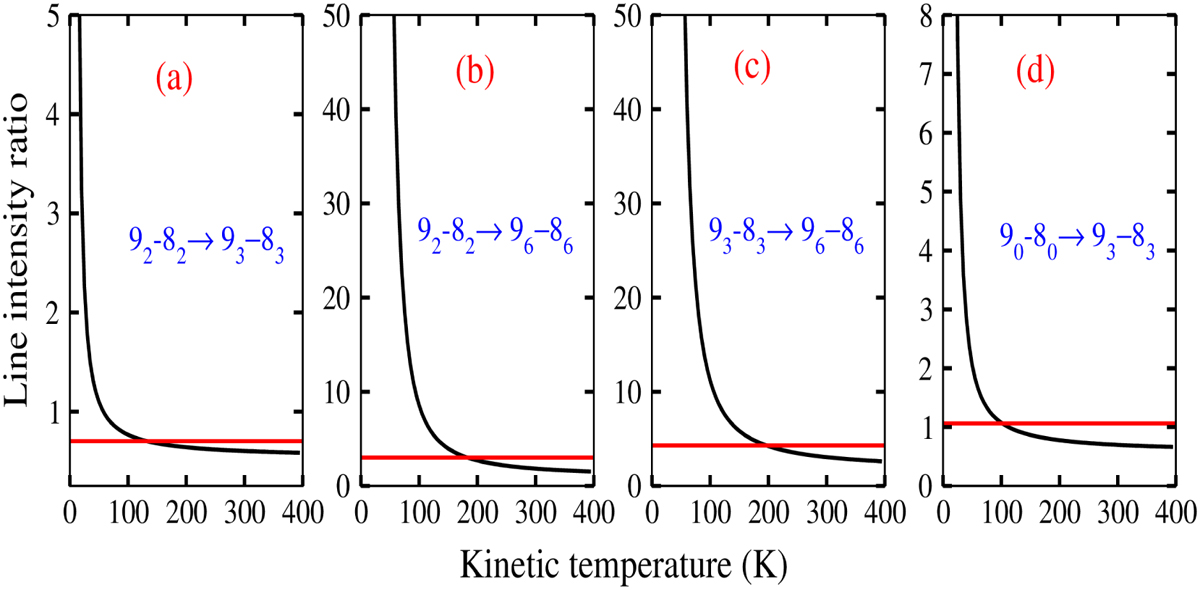
Black line represents the expected line intensity ratio variation with the kinetic temperature, whereas the red line represents the observed intensity ratio. The ratios of CH3CCH transitions are plotted in panels a, b, and c, and that of CH313CCH is given in panel d.
Current usage metrics show cumulative count of Article Views (full-text article views including HTML views, PDF and ePub downloads, according to the available data) and Abstracts Views on Vision4Press platform.
Data correspond to usage on the plateform after 2015. The current usage metrics is available 48-96 hours after online publication and is updated daily on week days.
Initial download of the metrics may take a while.