Fig. D.1
Download original image
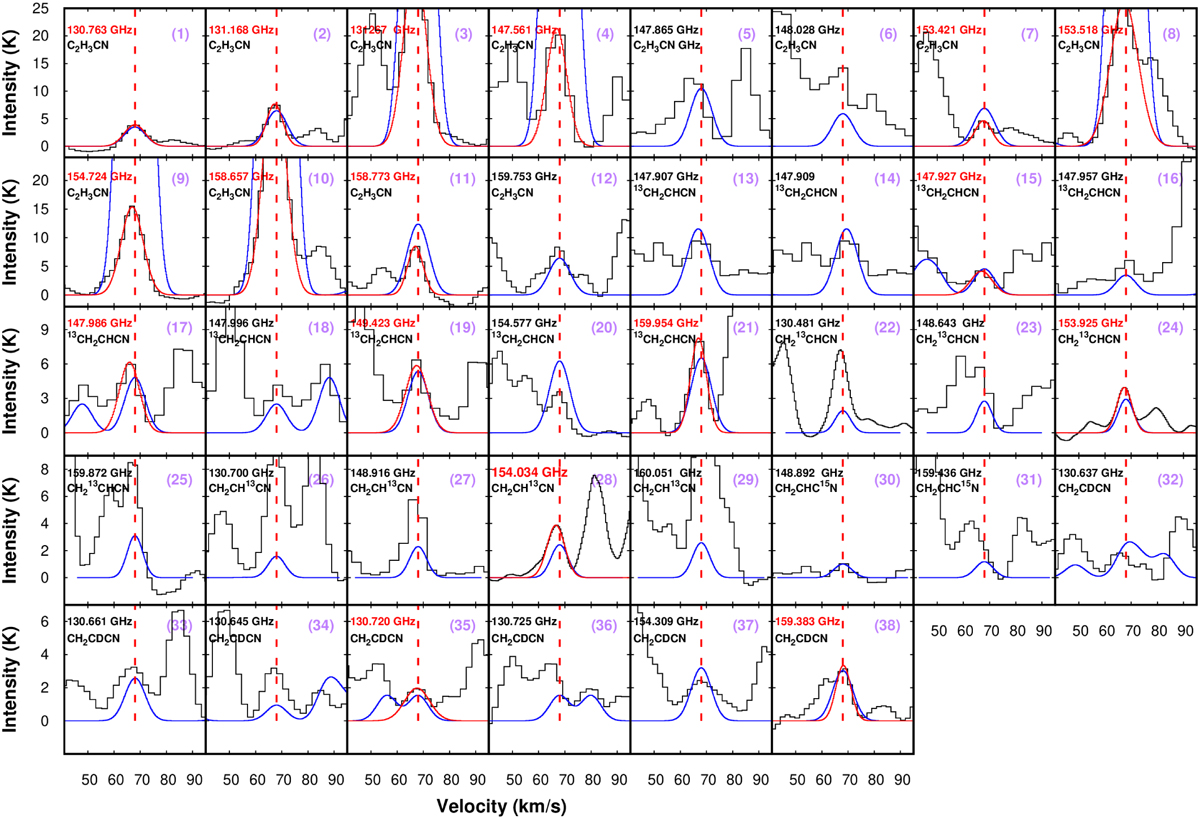
Black lines represent observed spectra of vinyl cyanide and its isotopologues (13CH2CHCN, CH213CCN, CH2CH13CN, CH2CNC15N, and CH2CDCN). Unblended transitions are noted in red, whereas blended transitions are given in black. The solid red lines represent the Gaussian fit of the unblended transitions. LTE spectra (LTE2) are shown in blue by considering N(H2) = 1.35 × 1025 cm−2, an excitation temperature of 15° K, average source size (average of emitting regions of unblended transitions), and the average FWHM (obtained from the unblended, optically thin transitions) of the species. The column density of the species is varied until estimated good fits are obtained by eye. The red dashed lines show the systematic velocity (VLSR) of the source at ~ 68 km s−1. In addition, the name of the species and their respective transitions (in GHz) are provided in each panel.
Current usage metrics show cumulative count of Article Views (full-text article views including HTML views, PDF and ePub downloads, according to the available data) and Abstracts Views on Vision4Press platform.
Data correspond to usage on the plateform after 2015. The current usage metrics is available 48-96 hours after online publication and is updated daily on week days.
Initial download of the metrics may take a while.