Fig. C.1
Download original image
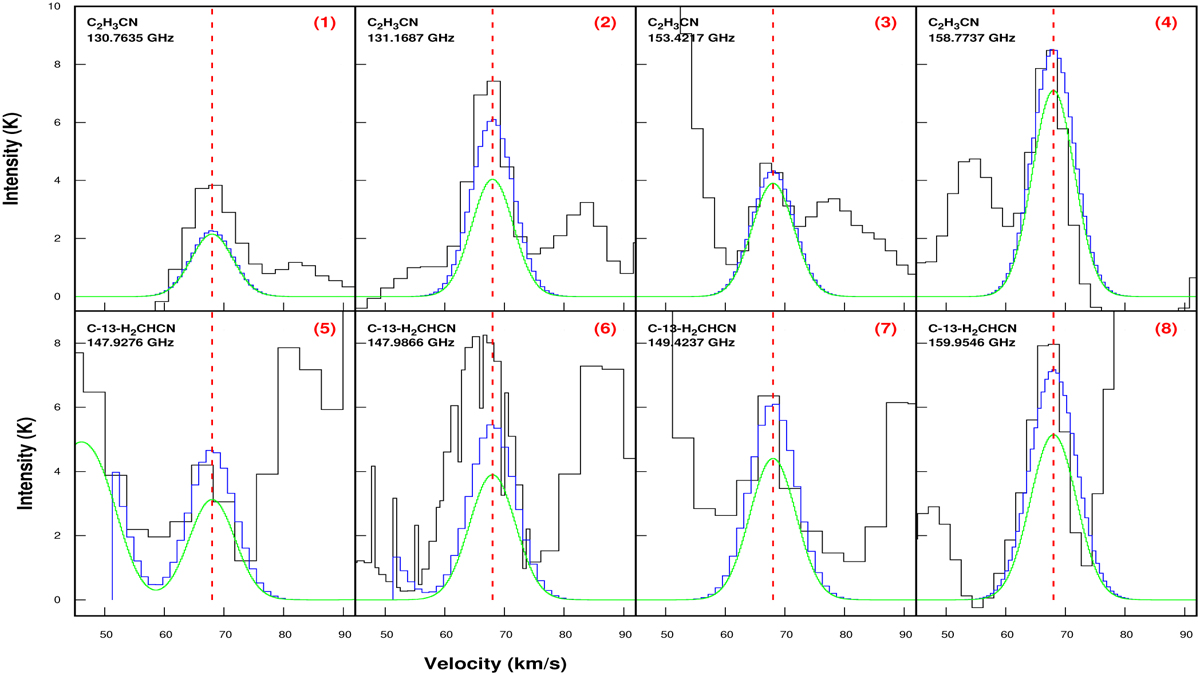
MCMC fit of observed, unblended, optically thin transitions of vinyl cyanide and its isotopologues (solid green lines). The blue lines represent the modeled spectra, whereas the observed spectra are shown in black. The vertical red dashed line shows the position of Vlsr = 68 km/s. The green solid lines represent the LTE spectra of some species by considering the rotational temperature and column density obtained from the rotational diagram analysis (see Fig. 1).
Current usage metrics show cumulative count of Article Views (full-text article views including HTML views, PDF and ePub downloads, according to the available data) and Abstracts Views on Vision4Press platform.
Data correspond to usage on the plateform after 2015. The current usage metrics is available 48-96 hours after online publication and is updated daily on week days.
Initial download of the metrics may take a while.