Fig. 17
Download original image
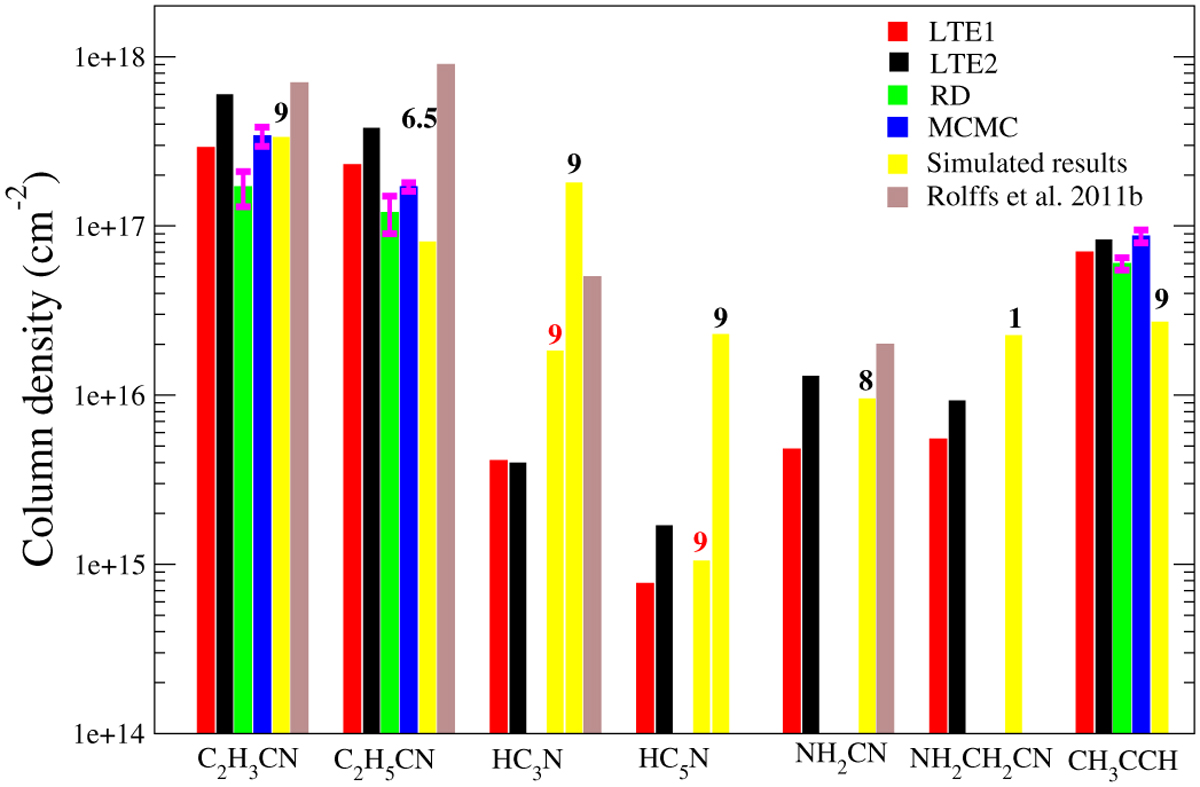
Observed and simulated column density of the species are shown. LTE1 represents column density obtained with a constant source size of 2″, whereas LTE2 represents the cases with the average emitting regions of each species. Simulated column densities (obtained in bestfit 1D model) are shown in yellow. The grid number (noted in black) of the modeled column density represents the peak column density of that grid, which matches well with the observed results. For HC3N and HC5N, the modeled column density at ~2.5 × 10⁵ yr is additionally shown for the same grid number noted in red. Error bars obtained with the rotational diagram and MCMC methods are shown in magenta.
Current usage metrics show cumulative count of Article Views (full-text article views including HTML views, PDF and ePub downloads, according to the available data) and Abstracts Views on Vision4Press platform.
Data correspond to usage on the plateform after 2015. The current usage metrics is available 48-96 hours after online publication and is updated daily on week days.
Initial download of the metrics may take a while.