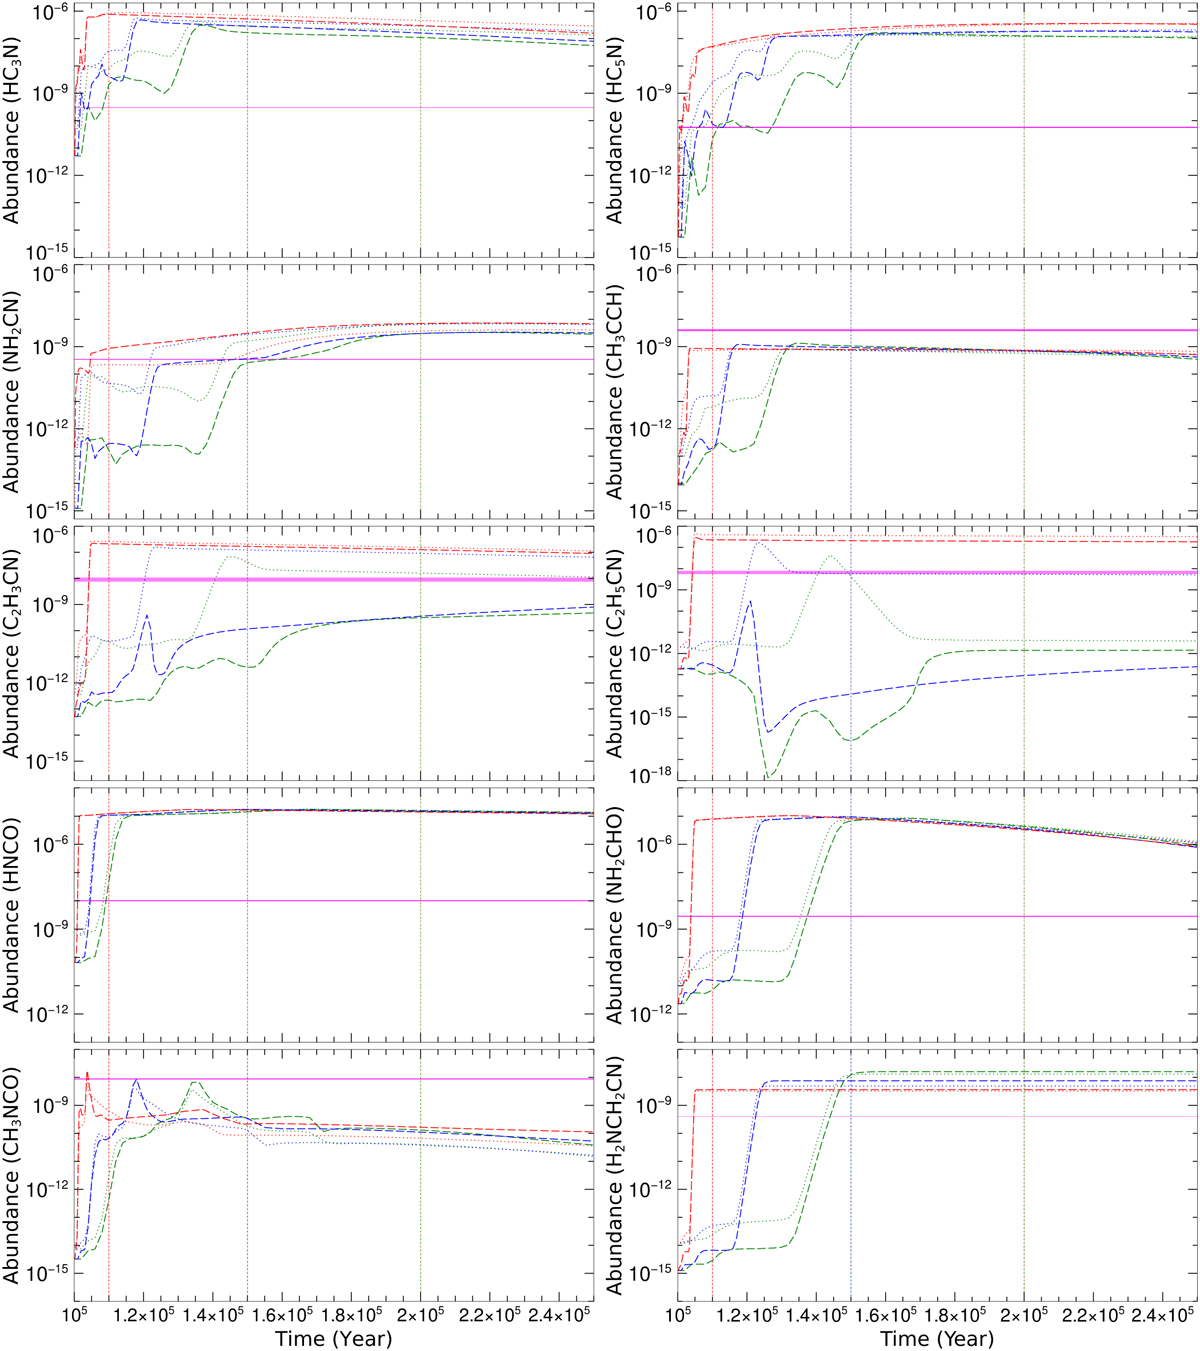
Fig. 14
Download original image
Impact of warm-up time (fast, mid, and slow cases are plotted in red, blue, and green, respectively) and final H density (dashed line (107 cm−3) versus dotted line (106 cm−3)) on simulated abundances of selected species. Red, blue, and green dashed lines are for models N7-Tg200-Td20-fast-wup, N7-Tg200-Td20, and N7-Tg200-Td20-slow-wup, respectively, and red, blue, and green dotted lines are for models N6-Tg200-Td20-fast-wup, N6-Tg200-Td20, and N6-Tg200-Td20-slow-wup, respectively. All plots are for both warm-up and post-warm-up stages, with both stages separated by red, blue, and green vertical dotted lines for fast, mid, and slow cases, respectively. Pink horizontal bar represents the observed value in G10 (see Table 3 for details of each model).
Current usage metrics show cumulative count of Article Views (full-text article views including HTML views, PDF and ePub downloads, according to the available data) and Abstracts Views on Vision4Press platform.
Data correspond to usage on the plateform after 2015. The current usage metrics is available 48-96 hours after online publication and is updated daily on week days.
Initial download of the metrics may take a while.