Fig. 1
Download original image
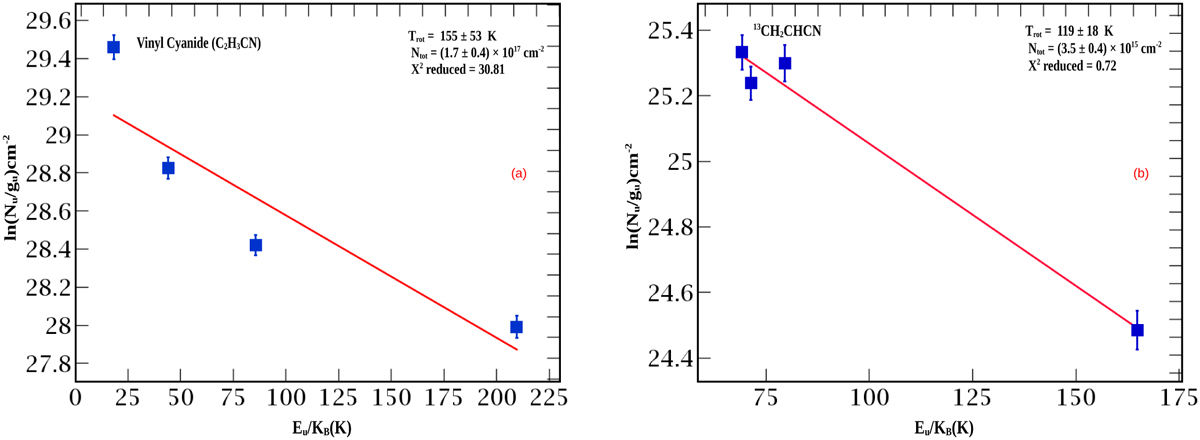
Rotational diagram of (a) vinyl cyanide (C2H3CN) and (b) its one istotopologue (13CH2CHCN). The best fitted rotational temperature and column density are given in each panel. Filled blue squares are the data points and the blue line represents the error bar. The error bar of each transition is calculated from rms noise (varies 117 mK to 306 mK) and calibration error (considering 5%).
Current usage metrics show cumulative count of Article Views (full-text article views including HTML views, PDF and ePub downloads, according to the available data) and Abstracts Views on Vision4Press platform.
Data correspond to usage on the plateform after 2015. The current usage metrics is available 48-96 hours after online publication and is updated daily on week days.
Initial download of the metrics may take a while.