Fig. 8.
Download original image
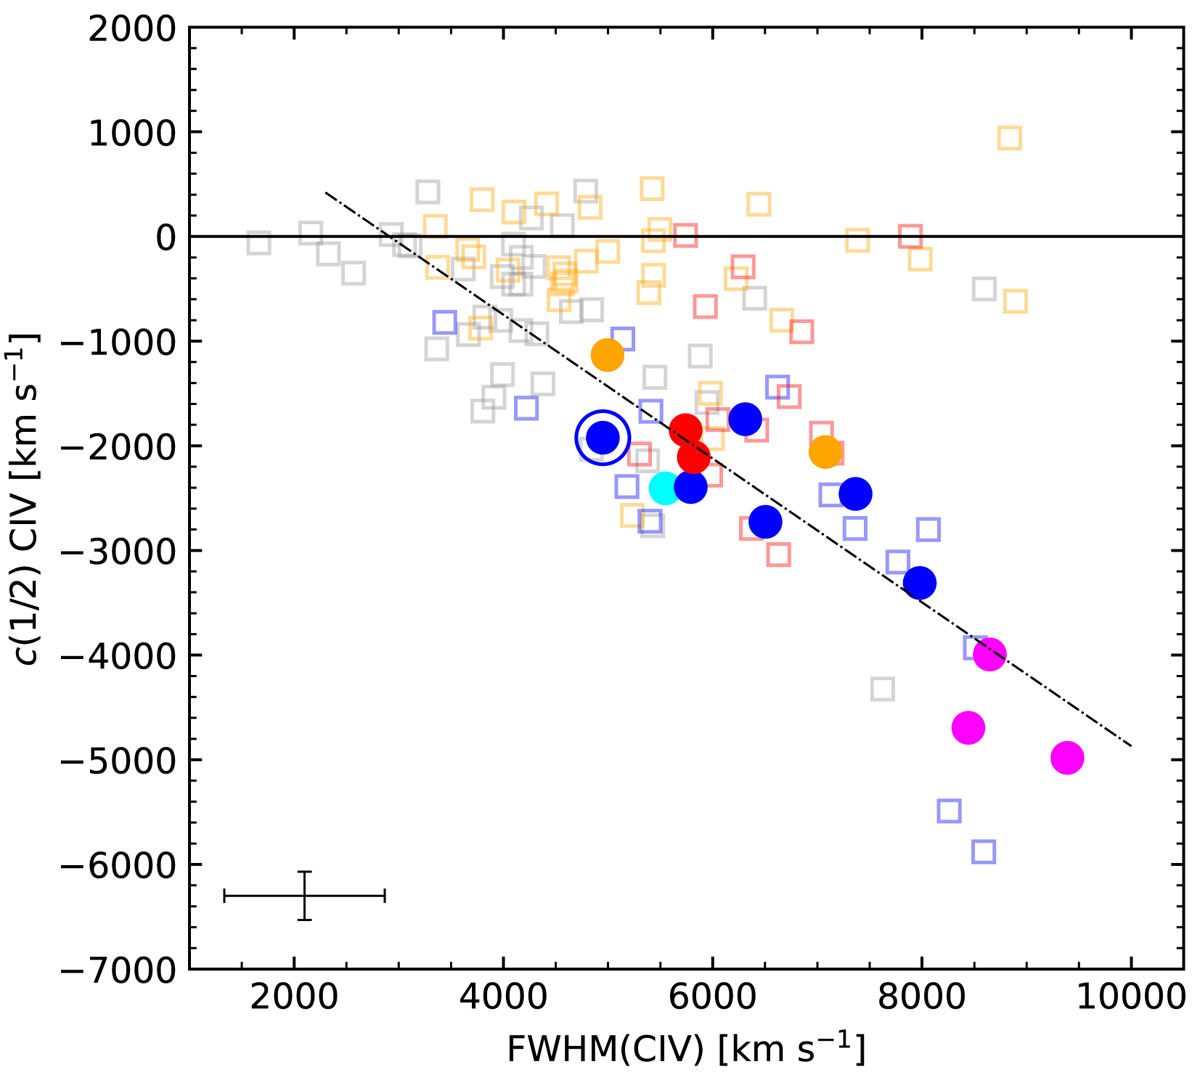
Centroid velocity at 1/2 flux intensity, c(1/2), for the C IVλ1549 emission line versus the FWHM of the full profile of C IV. Filled circles represent our sample and the colour scheme is the same as in Fig. 4. Blue and red open squares are high-redshift sources from S17. Low-z Pop. A and Pop. B are represented by grey and orange open squares, respectively. Dashed line represents the least squares linear regression presented in Eq. (2), including only Pop. A sources. Error bars refer to 1σ level of confidence for our sample.
Current usage metrics show cumulative count of Article Views (full-text article views including HTML views, PDF and ePub downloads, according to the available data) and Abstracts Views on Vision4Press platform.
Data correspond to usage on the plateform after 2015. The current usage metrics is available 48-96 hours after online publication and is updated daily on week days.
Initial download of the metrics may take a while.