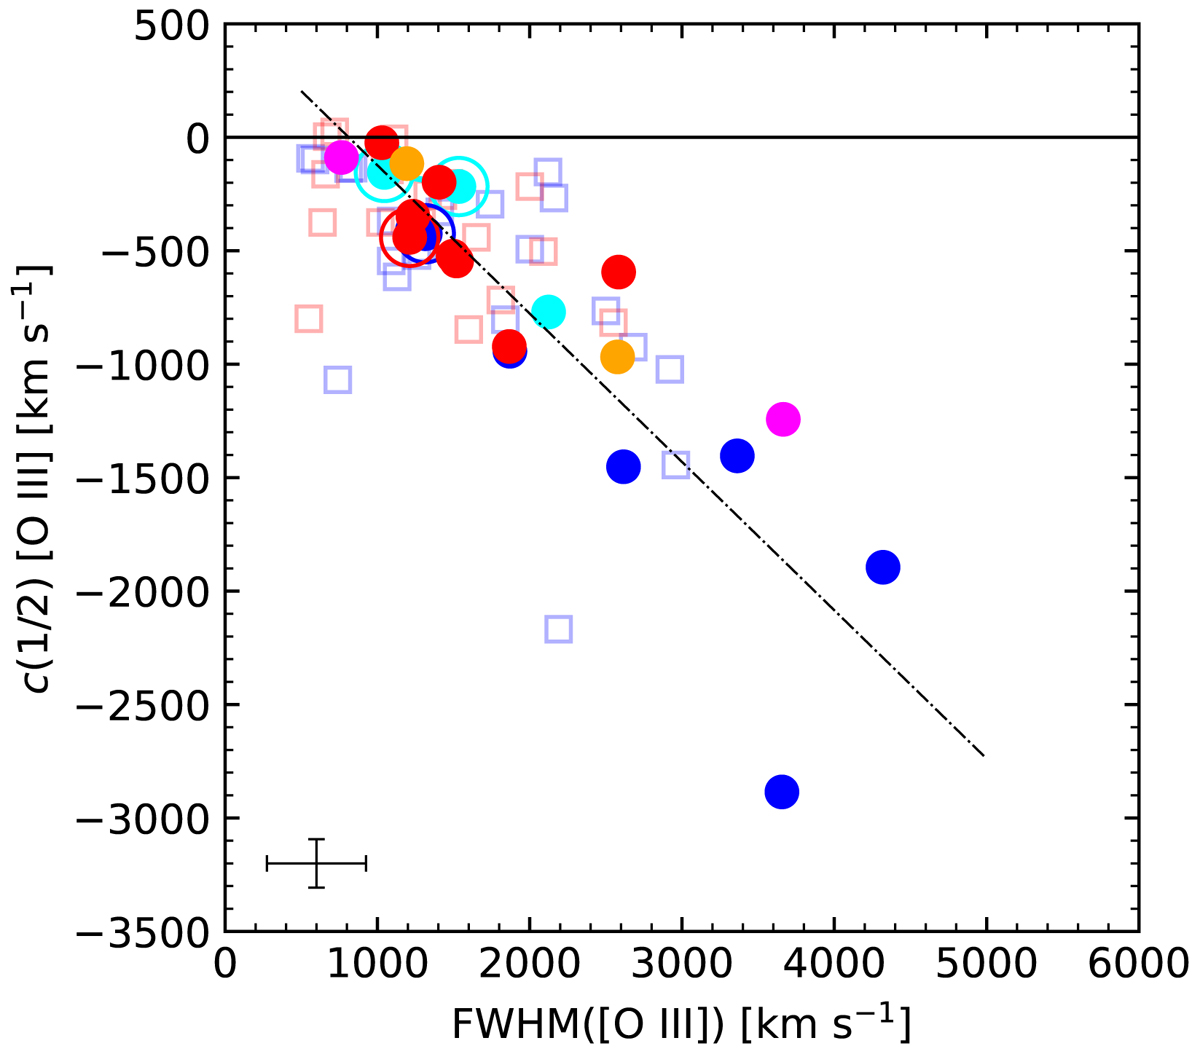
Fig. 6.
Download original image
FWHM of the full profile of [O III]λλ4959,5007 versus centroid at 1/2 flux intensity (c(1/2)) for the [O III]λλ4959,5007 emission line. Blue and red squares indicate high-redshift sources from M09. Dashed line represents a linear regression. Colour scheme is the same as in Fig. 4. Error bars refer to 1σ level of confidence and were estimated only for our sample.
Current usage metrics show cumulative count of Article Views (full-text article views including HTML views, PDF and ePub downloads, according to the available data) and Abstracts Views on Vision4Press platform.
Data correspond to usage on the plateform after 2015. The current usage metrics is available 48-96 hours after online publication and is updated daily on week days.
Initial download of the metrics may take a while.