Fig. 3.
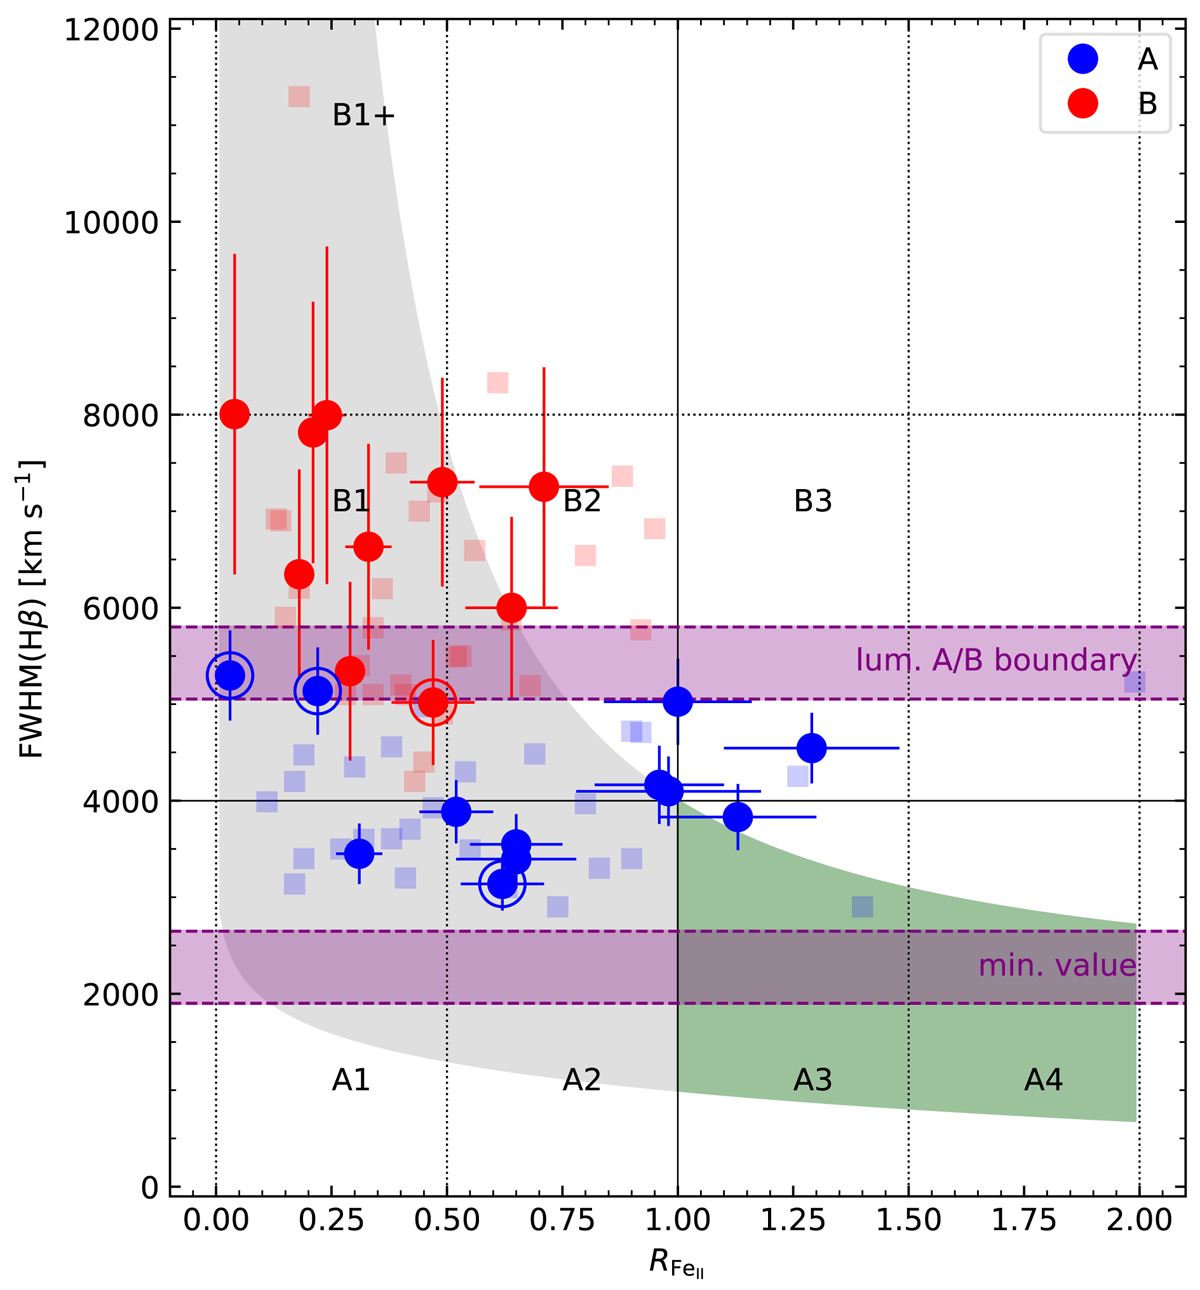
Download original image
Location of our sources through the optical plane of the 4DE1. Pop. A quasars are represented by blue circles and Pop. B by red circles. The radio-loud sources from the sample are surrounded by a circle in the plot. Grey and green regions indicate the distribution of the main sequence of quasars across the 4DE1 optical plane in a low-z context (Marziani et al. 2018). Spectral types (ST) of the MS are labelled according to Sulentic et al. (2002). Blue and red squares indicate high-redshift Pop. A and Pop. B quasars from M09, respectively. Purple-shaded areas show the luminosity-dependent boundary between Pops. A and B and the minimum FWHM value for sources with 47 ≤ Lbol ≤ 48 and assuming α = 0.67 (Marziani et al. 2009).
Current usage metrics show cumulative count of Article Views (full-text article views including HTML views, PDF and ePub downloads, according to the available data) and Abstracts Views on Vision4Press platform.
Data correspond to usage on the plateform after 2015. The current usage metrics is available 48-96 hours after online publication and is updated daily on week days.
Initial download of the metrics may take a while.