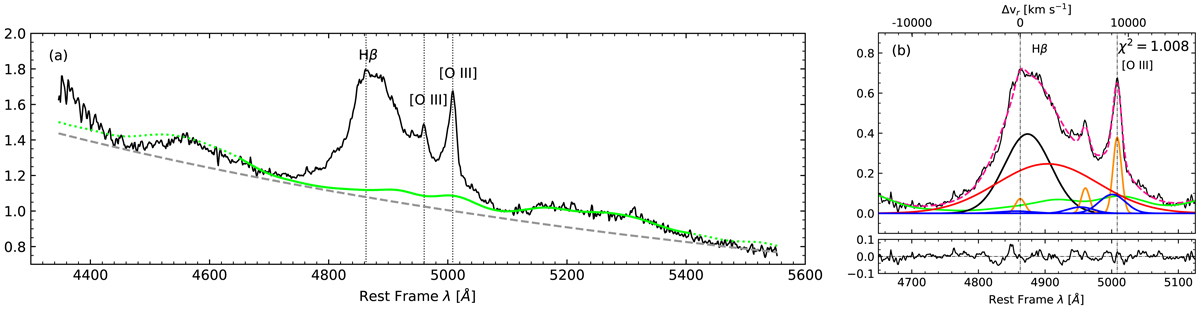
Fig. A.1.
Download original image
HE 0001-2340: (a) Rest-frame spectrum covering the Hβ spectral range obtained with VLT/ISAAC. The spectrum is normalised by the continuum at 5100 Å (the flux values are available at Table 4). The grey dashed line traces a power law that defines the continuum level as obtained with the SPECFIT multicomponent analysis. The green line shows the Fe II contribution. For this object Fe II was fitted only with the red Fe II blend due to the presence of atmospheric absorption in the blue. The vertical dotted lines indicate the rest-frame of the main emission lines in the Hβ spectral range and the grey-shaded area indicate the regions that were not considered in the fittings. The white area indicates the region used to anchor both the continuum and the Fe II template. (b) Result of the fitting after continuum subtraction (upper panel) and the residuals (bottom panel) for the Hβ region. Pink dashed line shows the final fit. Broad Hβ component (BC) is represented by a black line meanwhile red line show the VBC. Orange lines represent narrow components and the blue ones correspond to the blueshifted components. The region in which the Fe II template was fitted is represented by the solid green line. Dotted green line indicate the expected Fe II contribution for the other parts of the spectra.
Current usage metrics show cumulative count of Article Views (full-text article views including HTML views, PDF and ePub downloads, according to the available data) and Abstracts Views on Vision4Press platform.
Data correspond to usage on the plateform after 2015. The current usage metrics is available 48-96 hours after online publication and is updated daily on week days.
Initial download of the metrics may take a while.