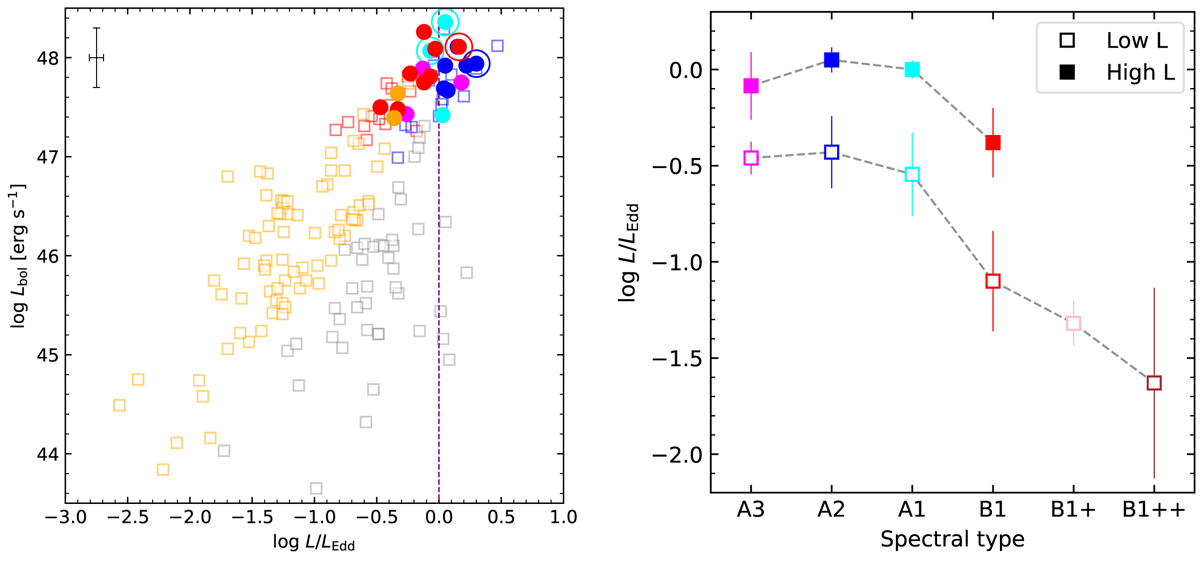
Fig. 17.
Download original image
Distribution of the different spectral types in a luminosity and Eddington ratio (L/LEdd) context. Left plot: bolometric luminosity Lbol vs. L/LEdd. Squared symbols identify the samples of S07 (low-z) and of S17 (high-z sources). Vertical purple line indicates L/LEdd = 1. Colour scheme is the same as in Fig. 4. Right plot: median values of the Eddington ratio separated into high-luminosity (log L > 47 erg s−1) and low luminosity for each spectral type. We have included our own sources, along with the comparison samples. Error bars indicate the semi-interquartile range.
Current usage metrics show cumulative count of Article Views (full-text article views including HTML views, PDF and ePub downloads, according to the available data) and Abstracts Views on Vision4Press platform.
Data correspond to usage on the plateform after 2015. The current usage metrics is available 48-96 hours after online publication and is updated daily on week days.
Initial download of the metrics may take a while.