Fig. 14.
Download original image
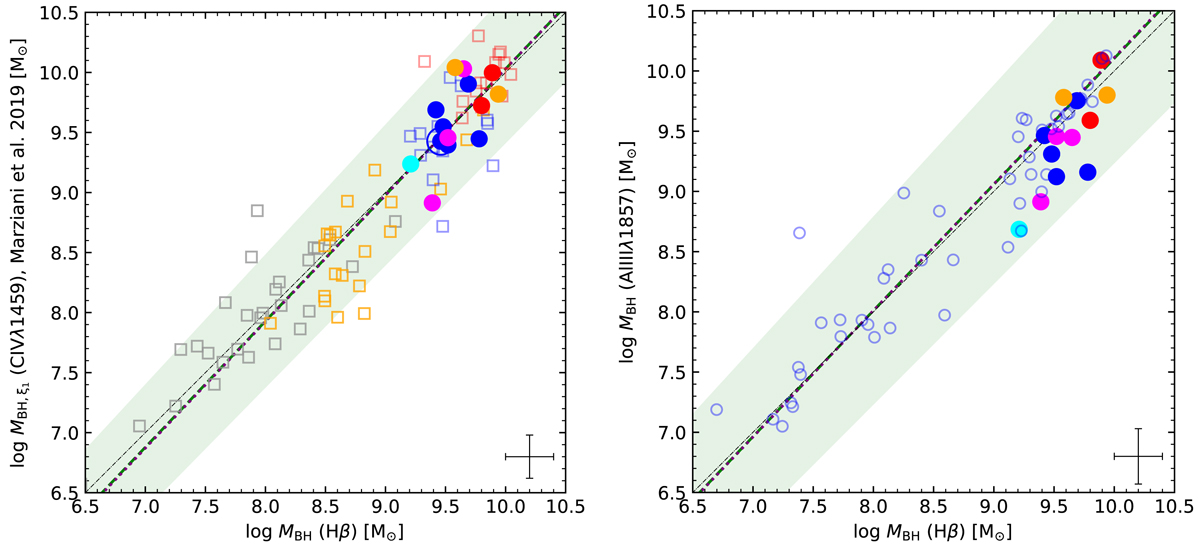
MBH(Hβ) compared to MBH(C IV), (left panel) and to MBH(Al III), (right panel). Open squares on the left plot represent the low- and high-redshift sources analysed by Marziani et al. (2019; blue and red for high-z and grey and orange for low-z Pop. A and Pop. B, respectively). Blue dots on the right panel are for the M22 data. Green and purple dashed lines indicate the linear regressions using bisector and orthogonal methods, respectively. Colour scheme is the same as in Fig. 4.
Current usage metrics show cumulative count of Article Views (full-text article views including HTML views, PDF and ePub downloads, according to the available data) and Abstracts Views on Vision4Press platform.
Data correspond to usage on the plateform after 2015. The current usage metrics is available 48-96 hours after online publication and is updated daily on week days.
Initial download of the metrics may take a while.