Fig. 10.
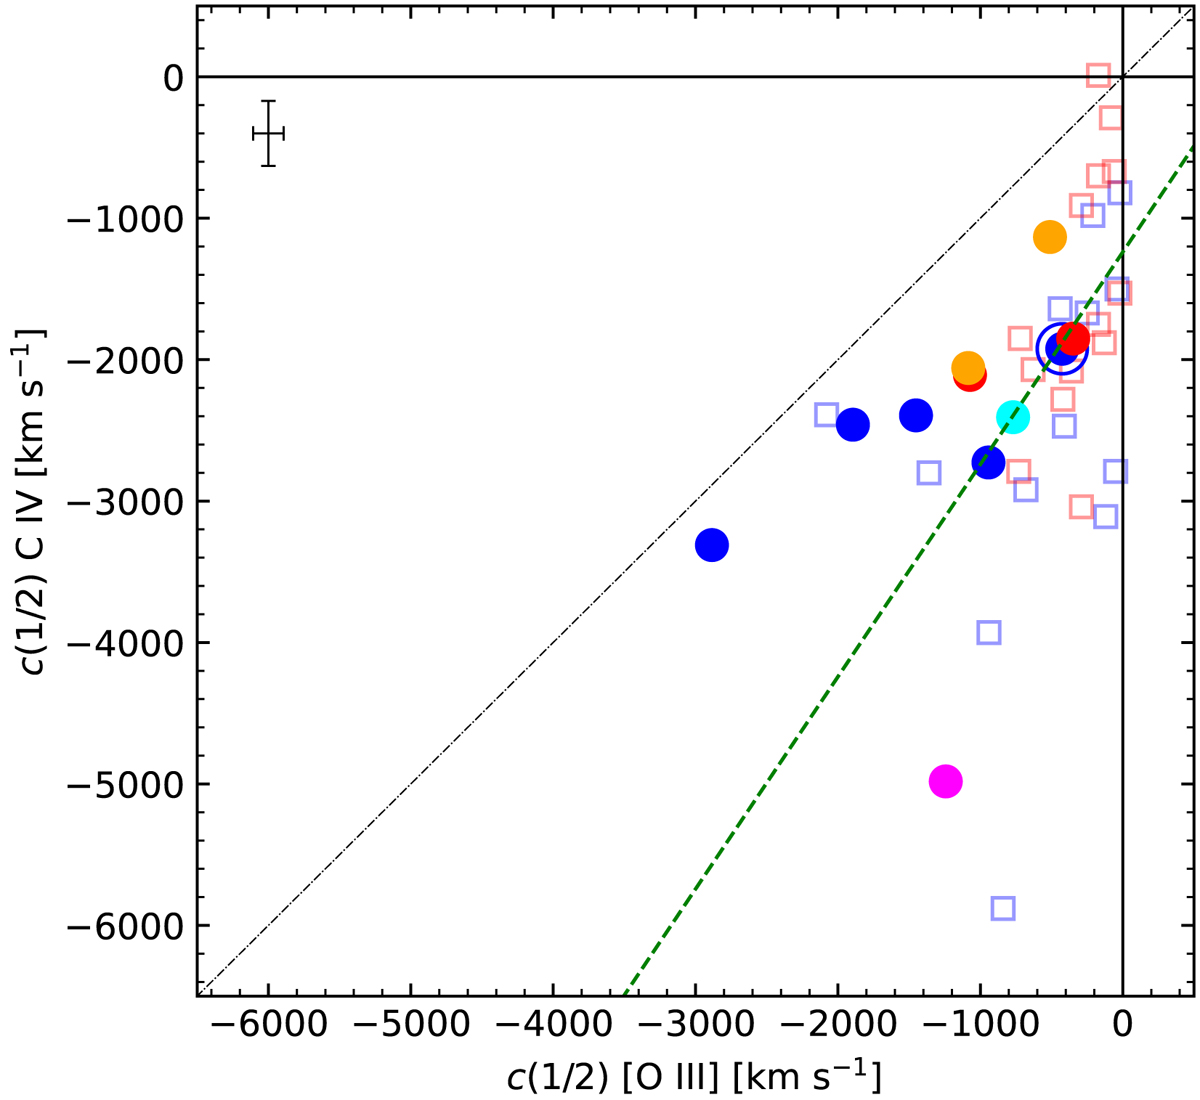
Download original image
Centroid velocity at 1/2 flux intensity (c(1/2)) of C IVλ1549 vs. c(1/2) of [O III]λλ4959,5007. Blue and red open squares show the HE Pop. A and Pop. B sources studied by M09 and S17. Colour scheme is the same as in Fig. 4. The green line indicates the linear regression between c(1/2) of C IVλ1549 and [O III]λλ4959,5007 obtained through the orthogonal least square method. The error bars refer to 1σ level of confidence for our sample.
Current usage metrics show cumulative count of Article Views (full-text article views including HTML views, PDF and ePub downloads, according to the available data) and Abstracts Views on Vision4Press platform.
Data correspond to usage on the plateform after 2015. The current usage metrics is available 48-96 hours after online publication and is updated daily on week days.
Initial download of the metrics may take a while.