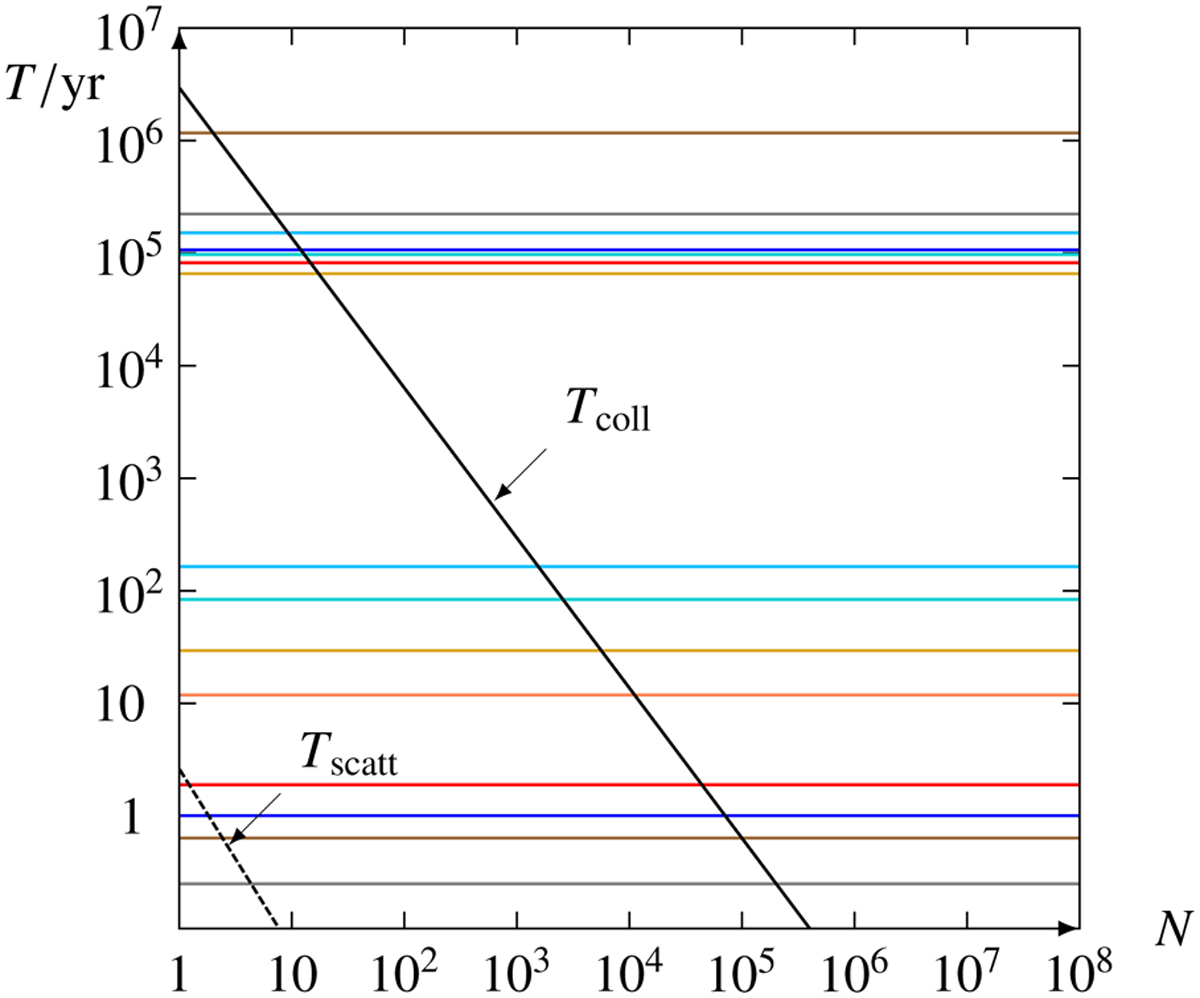
Fig. 14
Download original image
Timescale vs. particle count N. The horizontal lines are the orbital periods Tj and the precession periods Tprecj. of the Solar System planets (gray, brown, blue, red, coral, golden, turquoise, azure are Mercury through Neptune) from Murray & Dermott (2009). The black curve shows the collision time Tcoll estimated for a disk with a = 4au, I = .1, and a mass of three Earths containing N particles of Earth density. For N < 10, the collision time is comparable to the precession time (105yr). The radius of gravitational influence is roughly 103 times the planet radius s; this determines Tscatt, the dashed curve.
Current usage metrics show cumulative count of Article Views (full-text article views including HTML views, PDF and ePub downloads, according to the available data) and Abstracts Views on Vision4Press platform.
Data correspond to usage on the plateform after 2015. The current usage metrics is available 48-96 hours after online publication and is updated daily on week days.
Initial download of the metrics may take a while.