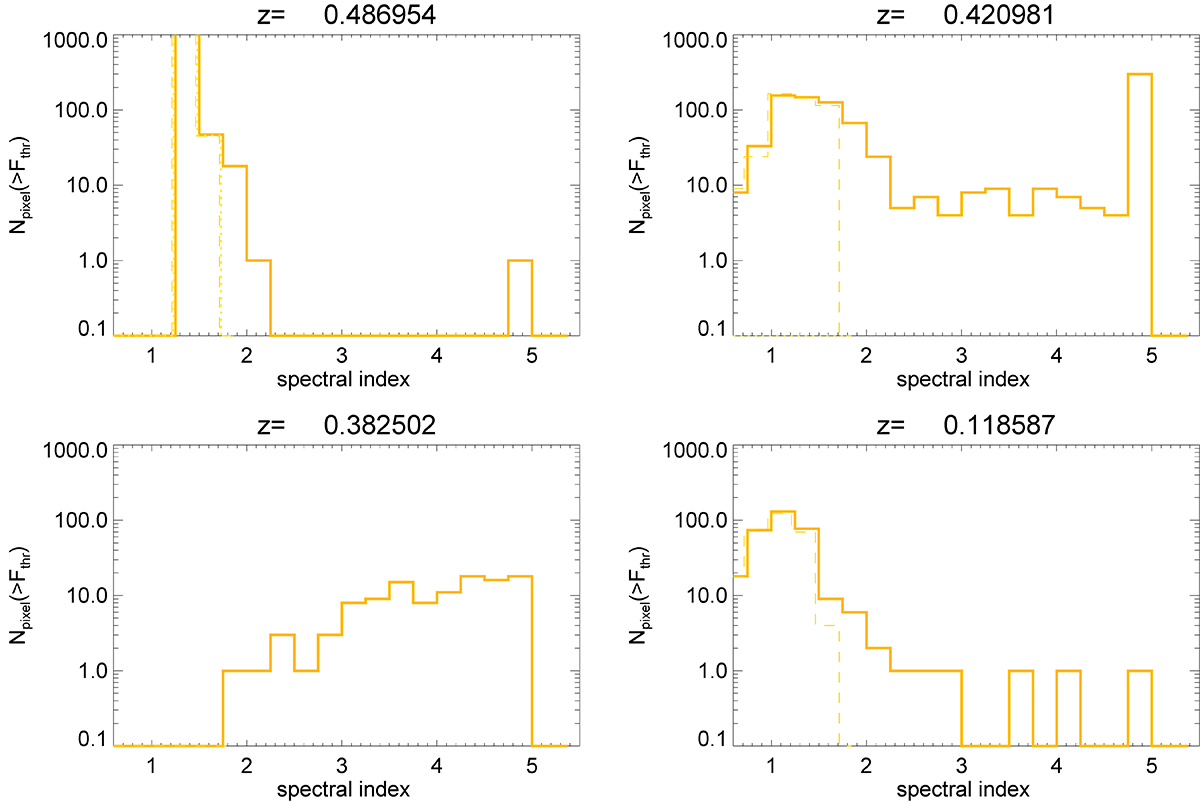
Fig. 16.
Download original image
Distributions of radio spectral index between 140 and 50 MHz, only for ≥1σrms detectable pixels in radio maps of the run E at four different epochs. The solid lines give the distribution of distribution of spectra for the electron evolution model including shocks and turbulent re-acceleration, the dashed lines are for the electron model only including shock re-acceleration and loss terms, and the dotted lines are for the electron model only including radiative losses and adiabatic changes after the injection by jets.
Current usage metrics show cumulative count of Article Views (full-text article views including HTML views, PDF and ePub downloads, according to the available data) and Abstracts Views on Vision4Press platform.
Data correspond to usage on the plateform after 2015. The current usage metrics is available 48-96 hours after online publication and is updated daily on week days.
Initial download of the metrics may take a while.