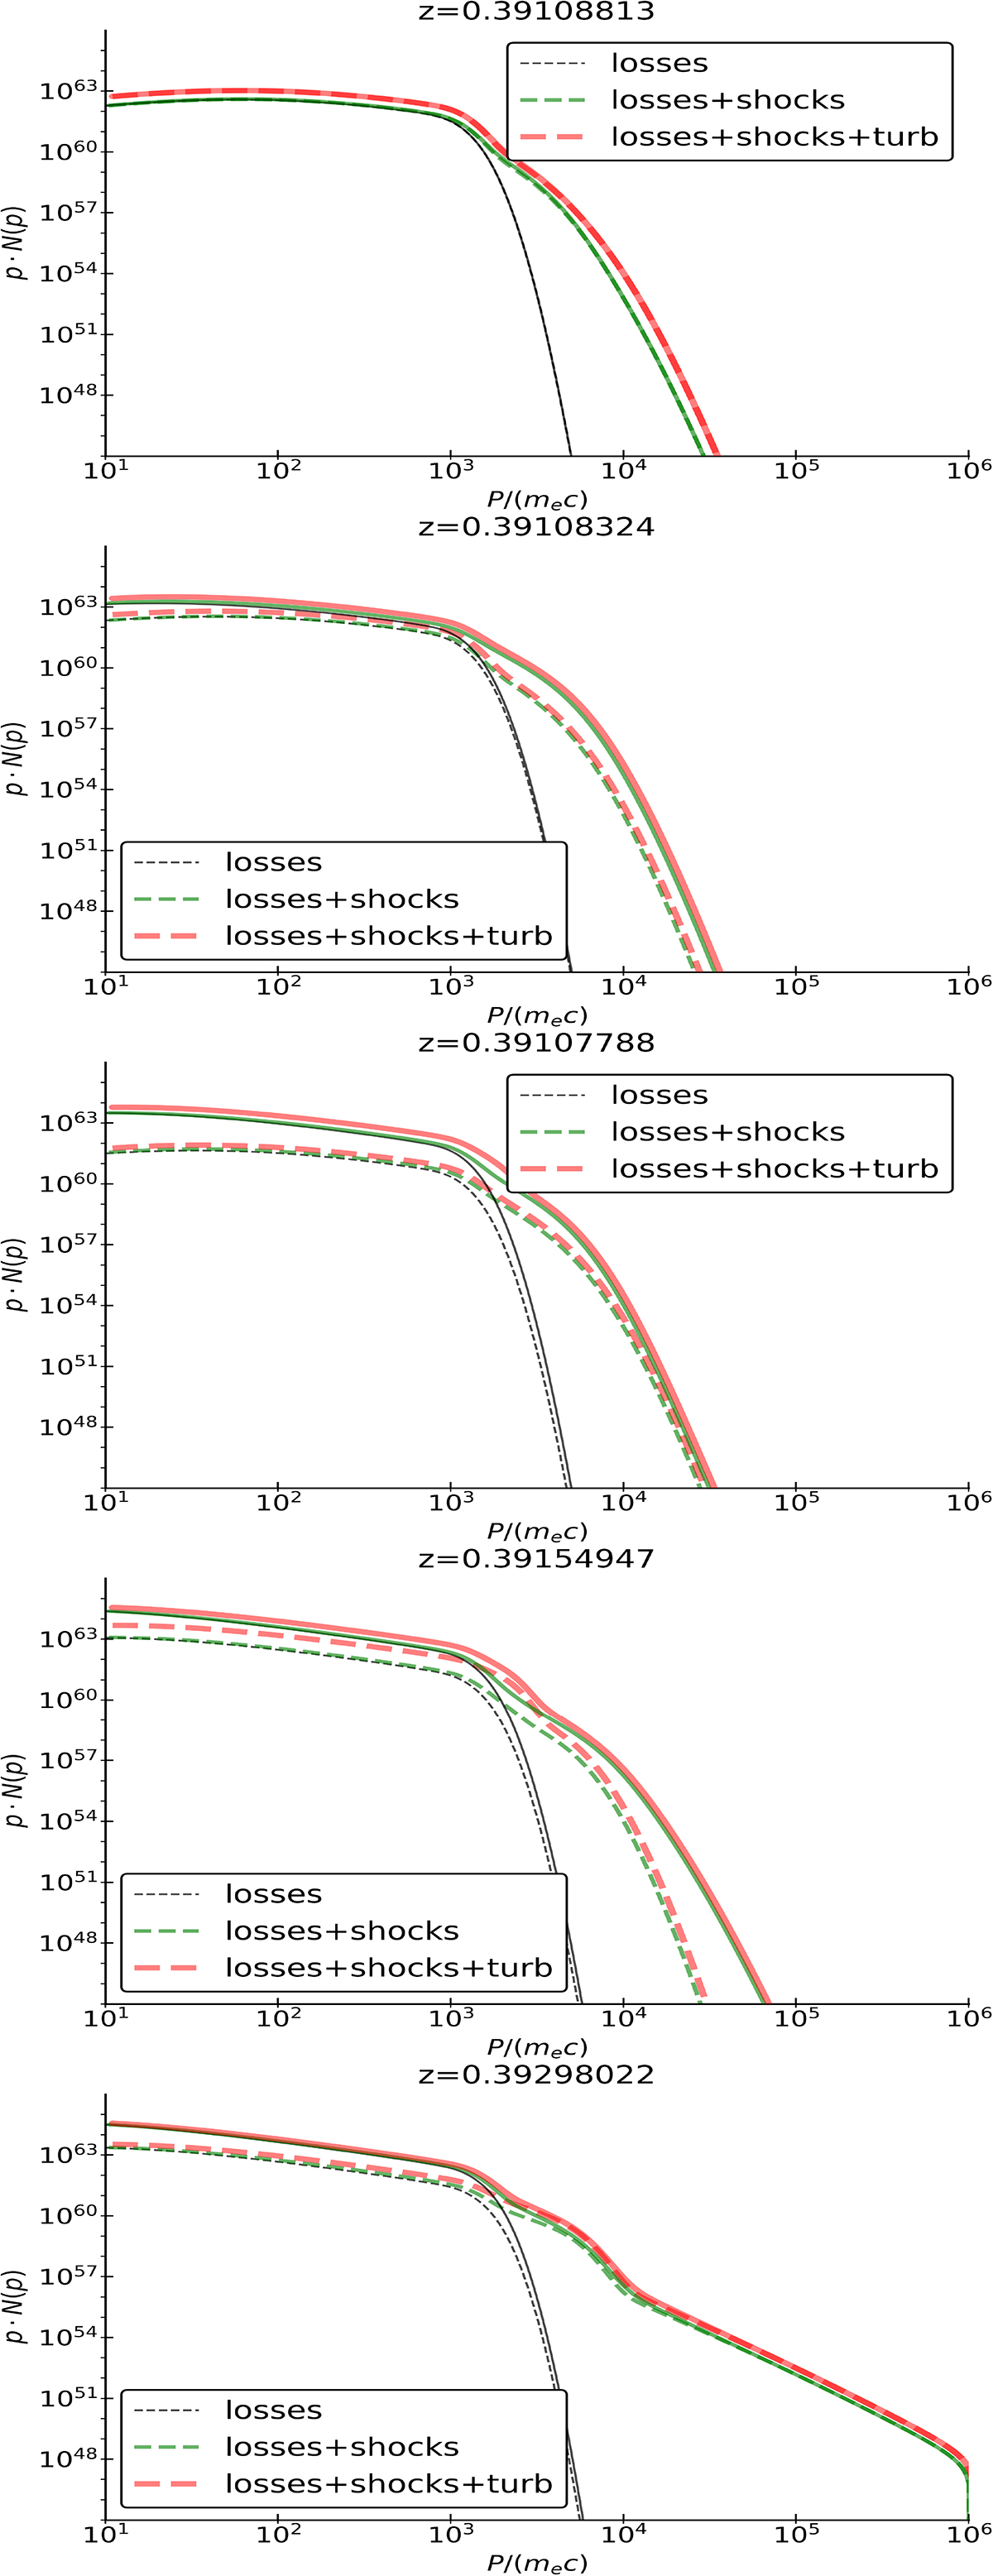
Fig. 10.
Download original image
Momentum distributions of electrons at z ≈ 0.39 in our five runs (i.e. ≈760 Myr after the jet injection), for the three different acceleration or cooling models (colours). The dashed lines are referred to the cluster region r ≤ 300 kpc while the solid line (here overlapping with the first) are for electrons at any distance from the cluster centre. The lowest power run B is at the top and the highest power run F is at the bottom.
Current usage metrics show cumulative count of Article Views (full-text article views including HTML views, PDF and ePub downloads, according to the available data) and Abstracts Views on Vision4Press platform.
Data correspond to usage on the plateform after 2015. The current usage metrics is available 48-96 hours after online publication and is updated daily on week days.
Initial download of the metrics may take a while.