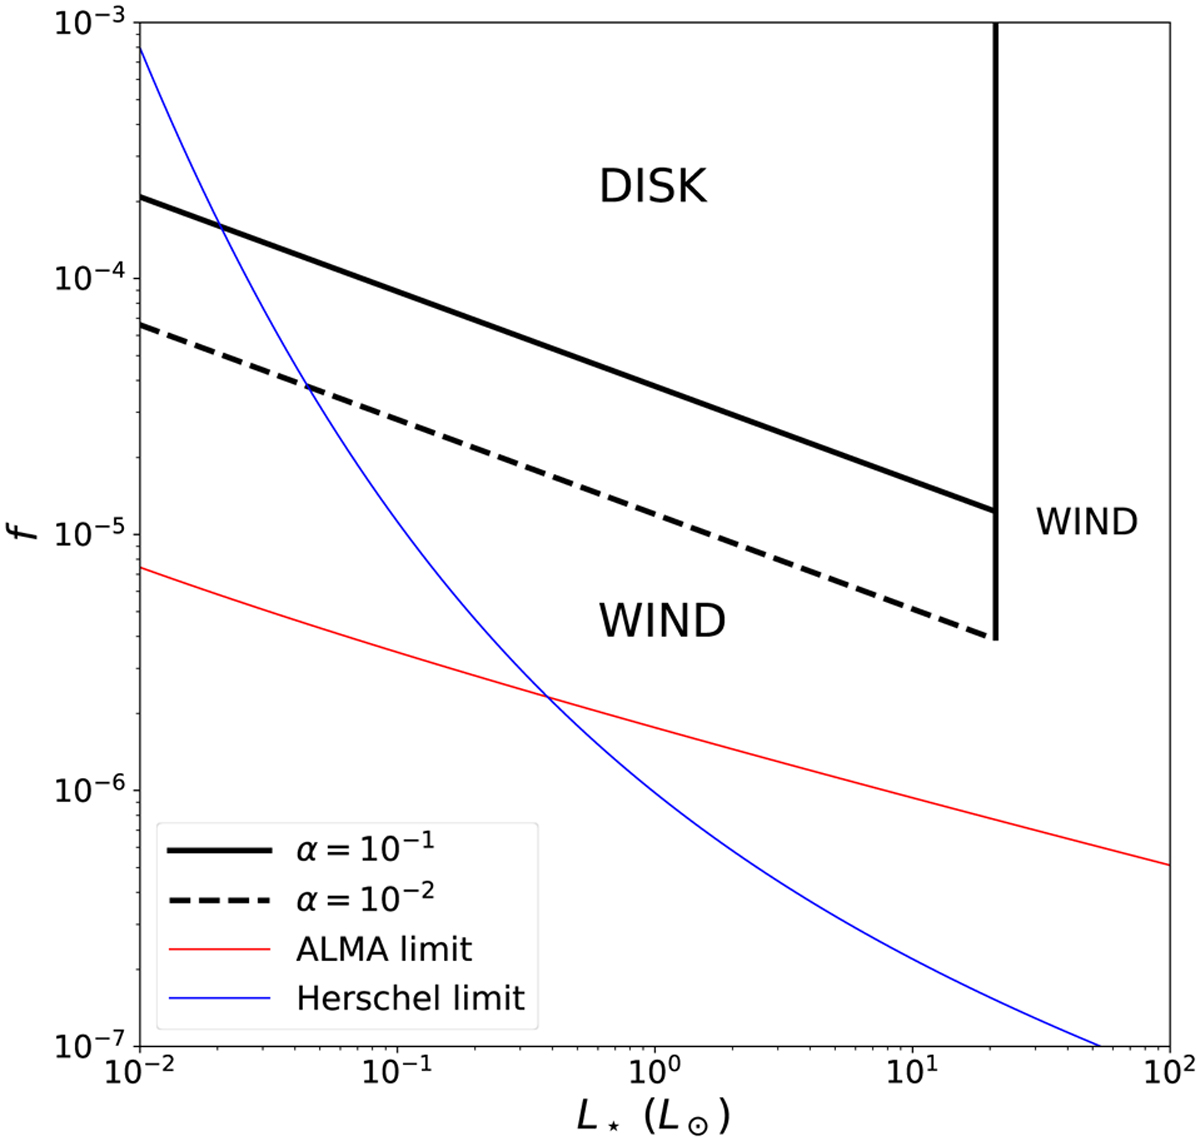
Fig. 9
Download original image
Transition between disk and wind regions shown in the space of the fractional luminosity of a debris disk as a function of the host star luminosity. The bottom left and far right regions are likely to be populated by gas having a wind structure while the upper left region would more likely be filled by circumstellar gas disks. We show the limit between disk and wind cases for two values of α: 0.1 (solid) and 0.01 (dashed). The thin red and blue lines are dust detection limits of ALMA at 870 microns and Herschel at 70 microns assuming dust lies at 100 au. See the assumptions behind this plot at the end of Appendix C.
Current usage metrics show cumulative count of Article Views (full-text article views including HTML views, PDF and ePub downloads, according to the available data) and Abstracts Views on Vision4Press platform.
Data correspond to usage on the plateform after 2015. The current usage metrics is available 48-96 hours after online publication and is updated daily on week days.
Initial download of the metrics may take a while.