Fig. 6
Download original image
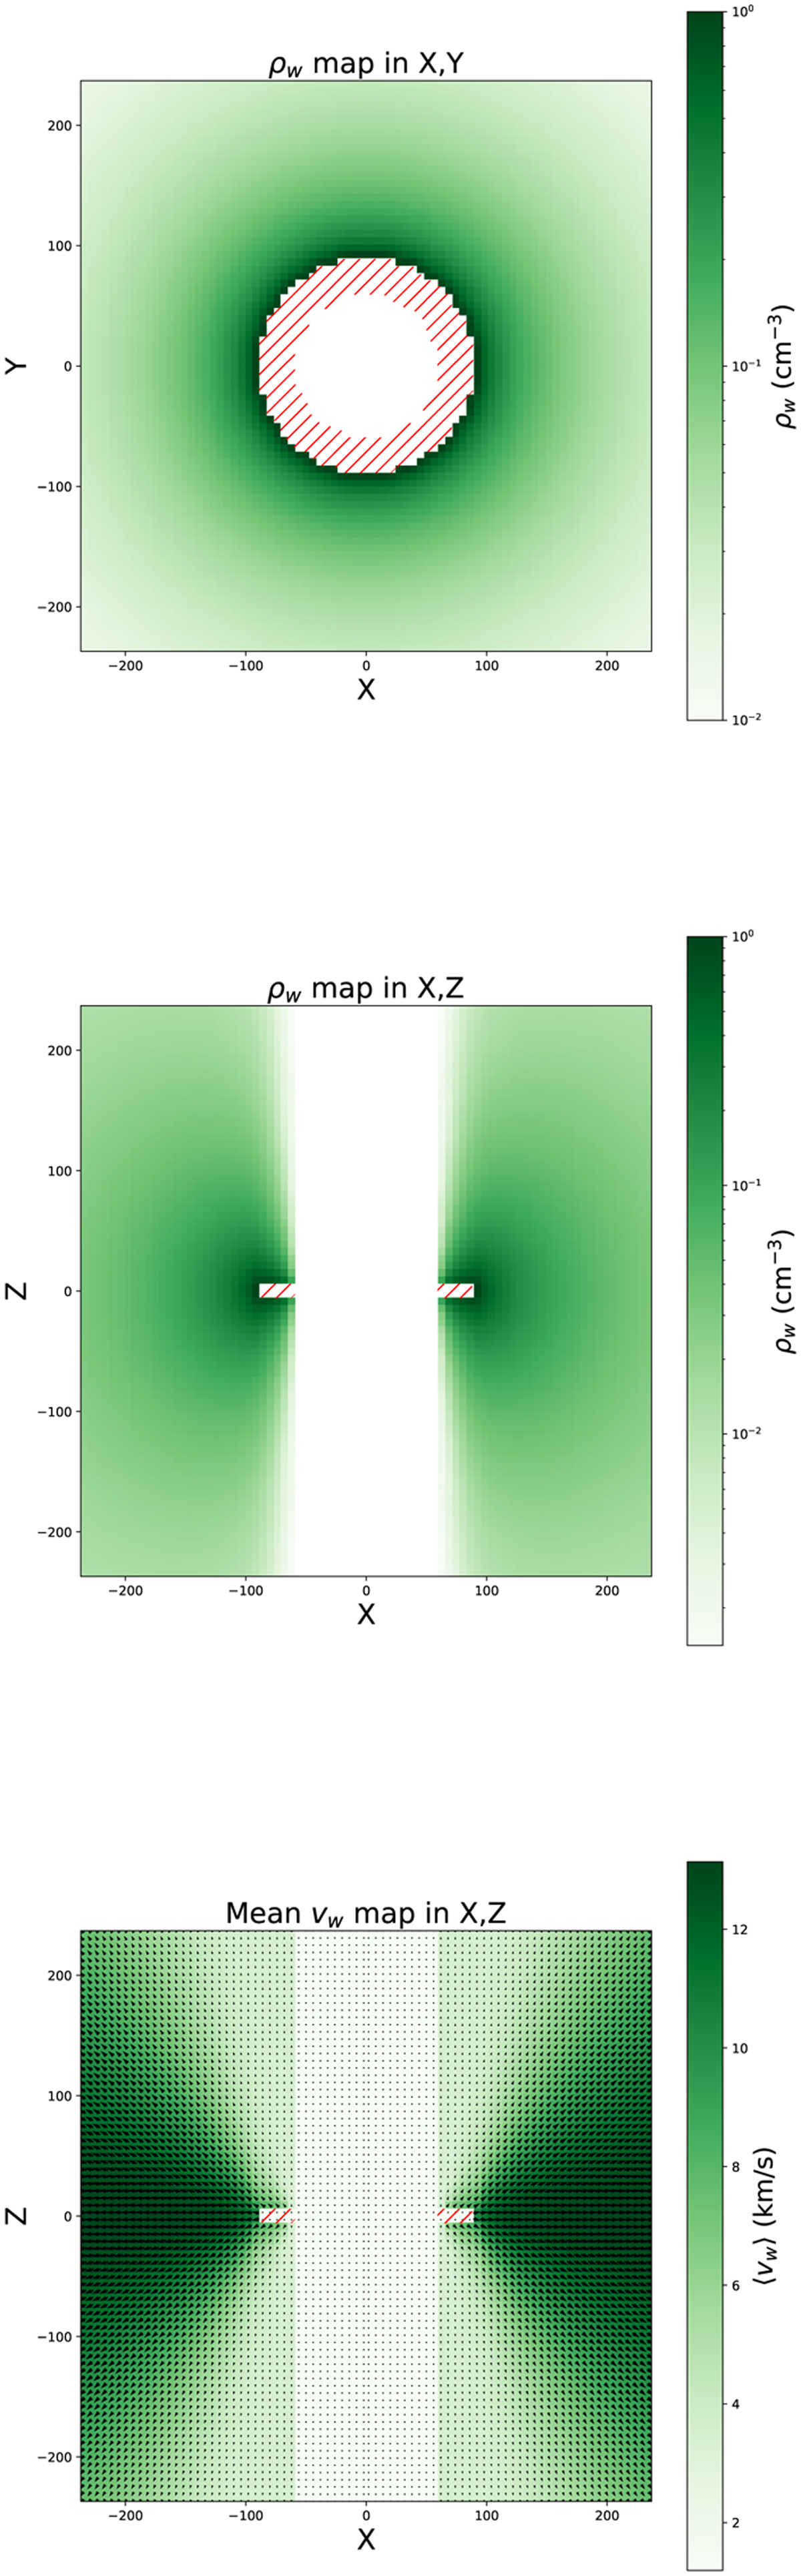
Wind structure for a belt extending from 60 to 90 au. Top: wind density in a (X, Y) plane at Z = 0 (cut in the midplane). The density was set to 1 cm−3 for the wind emerging from the belt. Middle: wind density in a (X, Z) plane at Y = 0 (cut at the middle of the belt). Bottom: velocity structure (direction and magnitude) integrated along the line of sight (assumed here to be along the Y axis). The red hatches show the location of the belt that releases gas.
Current usage metrics show cumulative count of Article Views (full-text article views including HTML views, PDF and ePub downloads, according to the available data) and Abstracts Views on Vision4Press platform.
Data correspond to usage on the plateform after 2015. The current usage metrics is available 48-96 hours after online publication and is updated daily on week days.
Initial download of the metrics may take a while.