Fig. 4
Download original image
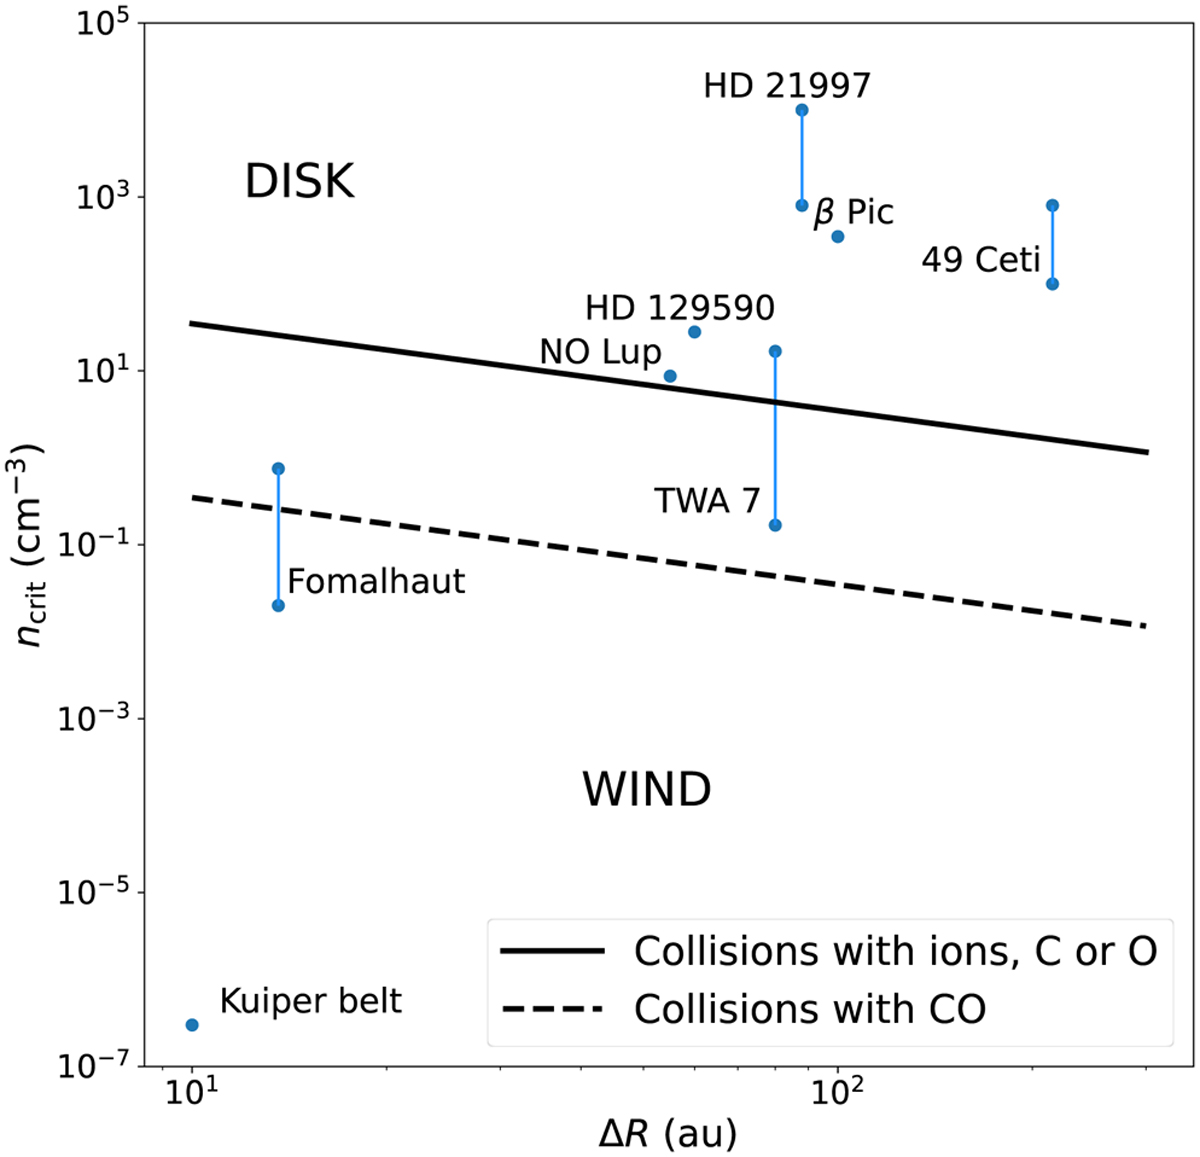
Critical density ncrit vs. the belt width ΔR. Lines represent the critical density ncrit at which the gas transition from a disk to a wind vs. ΔR. The solid line is for a model where ncrit is given by Eq. (5) and assumes that protons collide with ions, C or O. The dashed line is for collisions between protons and CO. We indicate in capital letters whether the gas would be more DISK- or WIND-like in different regions of the plot. We note that under the black lines, winds are very likely to behave as stated in the main text. The blue points show the gas density nd estimated for the different systems shown in the plot. A vertical line joins two blue dots when a range of values are given in the literature for the gas densities or masses. Data are given in Table H.1.
Current usage metrics show cumulative count of Article Views (full-text article views including HTML views, PDF and ePub downloads, according to the available data) and Abstracts Views on Vision4Press platform.
Data correspond to usage on the plateform after 2015. The current usage metrics is available 48-96 hours after online publication and is updated daily on week days.
Initial download of the metrics may take a while.