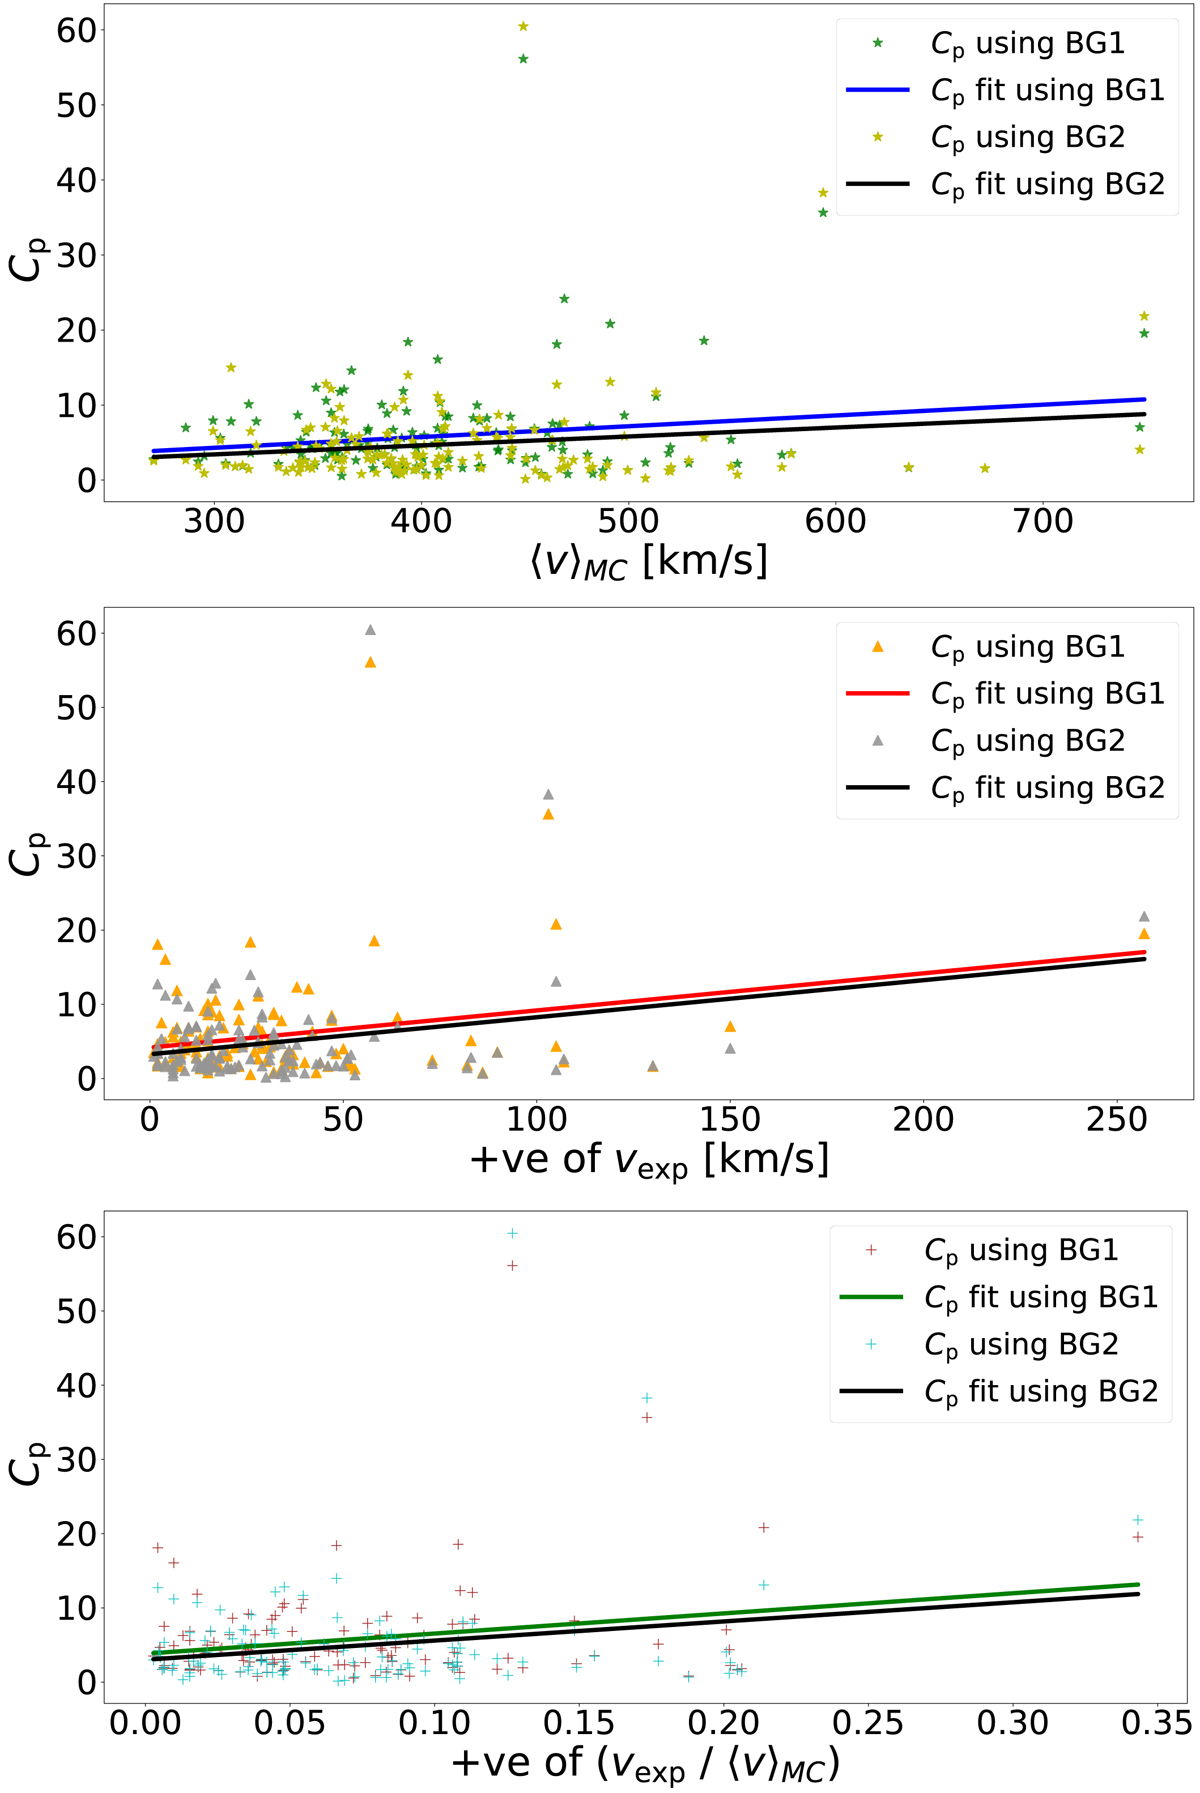
Fig. 7.
Download original image
Scatter plots of Cp with MC propagation and expansion speeds for all the events listed in Table A.1. The top panel is the scatter plot between Cp (Eq. (10) and the MC propagation speed (⟨v⟩MC). The correlation coefficient between Cp and ⟨v⟩MC is r = 0.18, with p = 2 × 10⁻² (for BG1) and r = 0.15, with p = 5 × 10⁻² (for BG2). The equation of the fitted lines corresponding to BG1 and BG2 are y = 0.01x − 0.004 and y = 0.01x − 0.1, respectively. The middle panel is the scatter plot between Cp and the MC expansion speed (vexp), only for events with vexp > 0. The correlation coefficients are r = 0.25, with p = 2 × 10⁻³ for BG1 and r = 0.25, with p = 5 × 10⁻³ for BG2. The equation of the fitted lines are y = 0.05x + 4.5 and y = 0.05x + 3.26, for BG1 and BG2, respectively. The bottom panel is the scatter plot between Cp and vexp/⟨v⟩MC, only for events with vexp > 0. The correlation coefficients are r = 0.23, with p = 6 × 10⁻³ (for BG1) and r = 0.22, with p = 10−3 (for BG2). The equation of the fitted lines are y = 25.3x + 4.30 (for BG1) and y = 25.78x + 3.02 (for BG2). The small p-values indicate a sufficiently high statistical confidence in estimating the r values for all three cases.
Current usage metrics show cumulative count of Article Views (full-text article views including HTML views, PDF and ePub downloads, according to the available data) and Abstracts Views on Vision4Press platform.
Data correspond to usage on the plateform after 2015. The current usage metrics is available 48-96 hours after online publication and is updated daily on week days.
Initial download of the metrics may take a while.