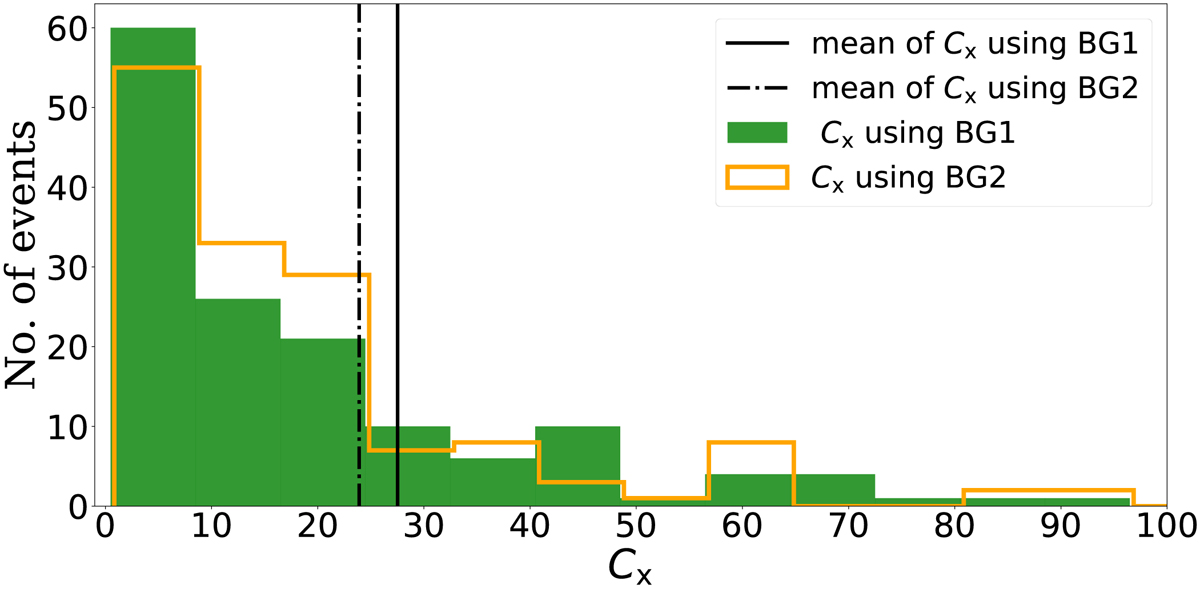
Fig. 2.
Download original image
Histograms of Cx (Eq. (9)), with γ = 5/3 and using the two backgrounds, BG1 and BG2. The mean, median, and the most probable value of Cx using BG1 are 27.53, 11.09, and 2.48, respectively while for BG2, they are 23.91, 14.02 and 4.36 respectively. The mean value for each histogram is marked by a vertical line. The maximum value shown on the x axis is limited to 100 for zooming in on the histogram peaks.
Current usage metrics show cumulative count of Article Views (full-text article views including HTML views, PDF and ePub downloads, according to the available data) and Abstracts Views on Vision4Press platform.
Data correspond to usage on the plateform after 2015. The current usage metrics is available 48-96 hours after online publication and is updated daily on week days.
Initial download of the metrics may take a while.