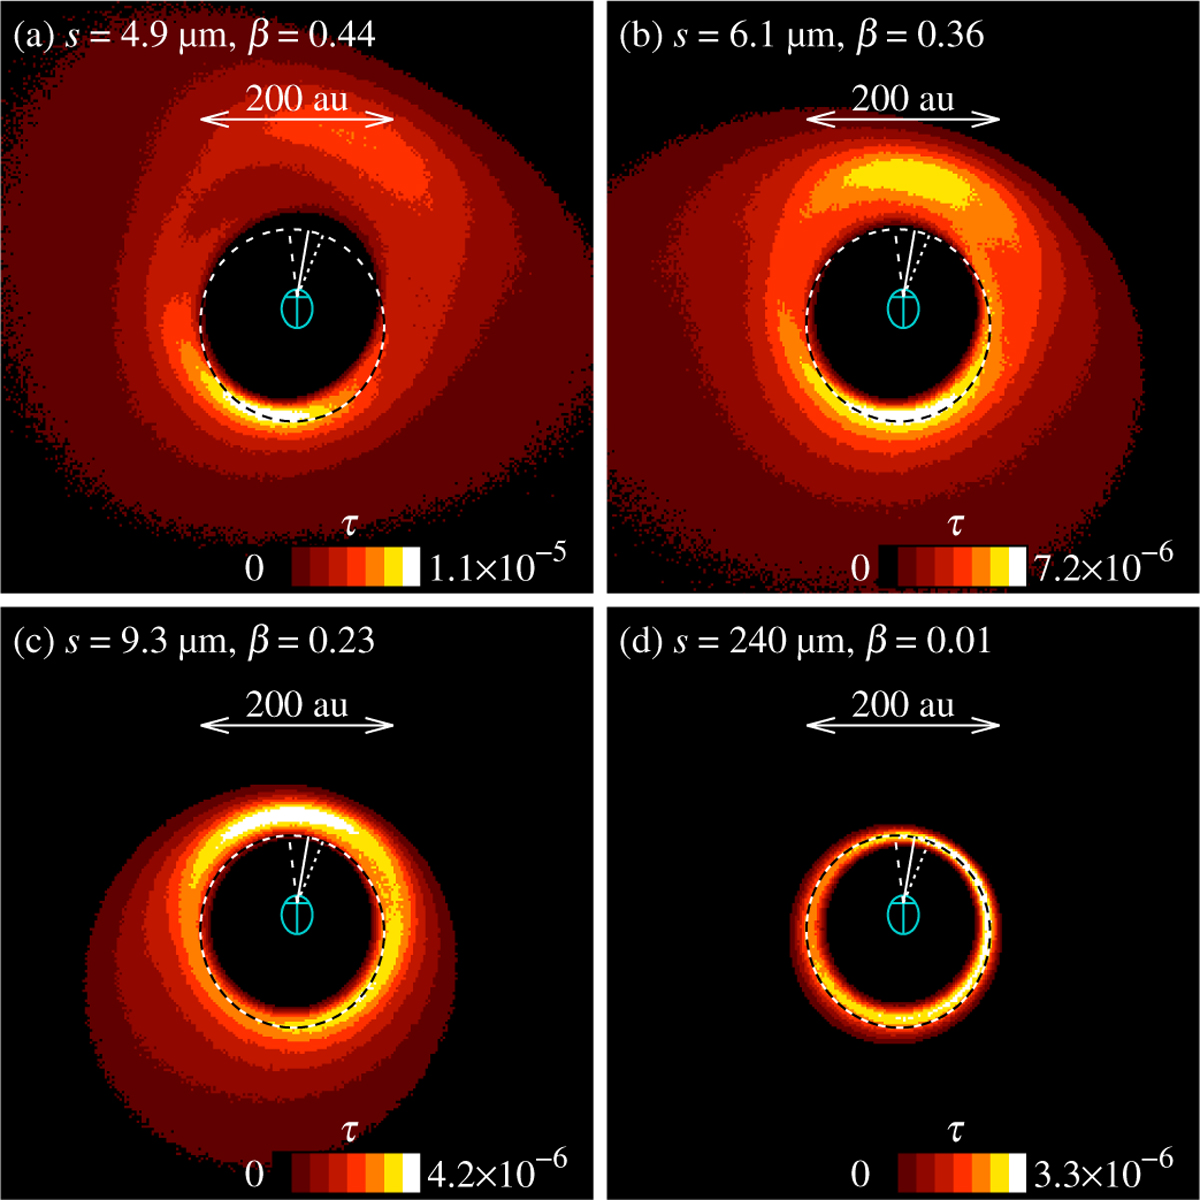
Fig. 2
Download original image
Maps of contributions to face-on optical depth, τ, in run n-i-M2 from grains of four different size bins with mean grain radii s and corresponding β ratios, as labeled in the top-left corners of the panels. The orbits of the perturbers are shown with blue-green ellipses, and the host star is at the crossings of the major axes and latera recta. Dashed black-and-white ellipses trace the center of the parent belt. White lines show the orientations and lengths of the pericenters at the belt center (solid) and the belt edges (dashed). Arrows indicate the scale.
Current usage metrics show cumulative count of Article Views (full-text article views including HTML views, PDF and ePub downloads, according to the available data) and Abstracts Views on Vision4Press platform.
Data correspond to usage on the plateform after 2015. The current usage metrics is available 48-96 hours after online publication and is updated daily on week days.
Initial download of the metrics may take a while.