Fig. 10
Download original image
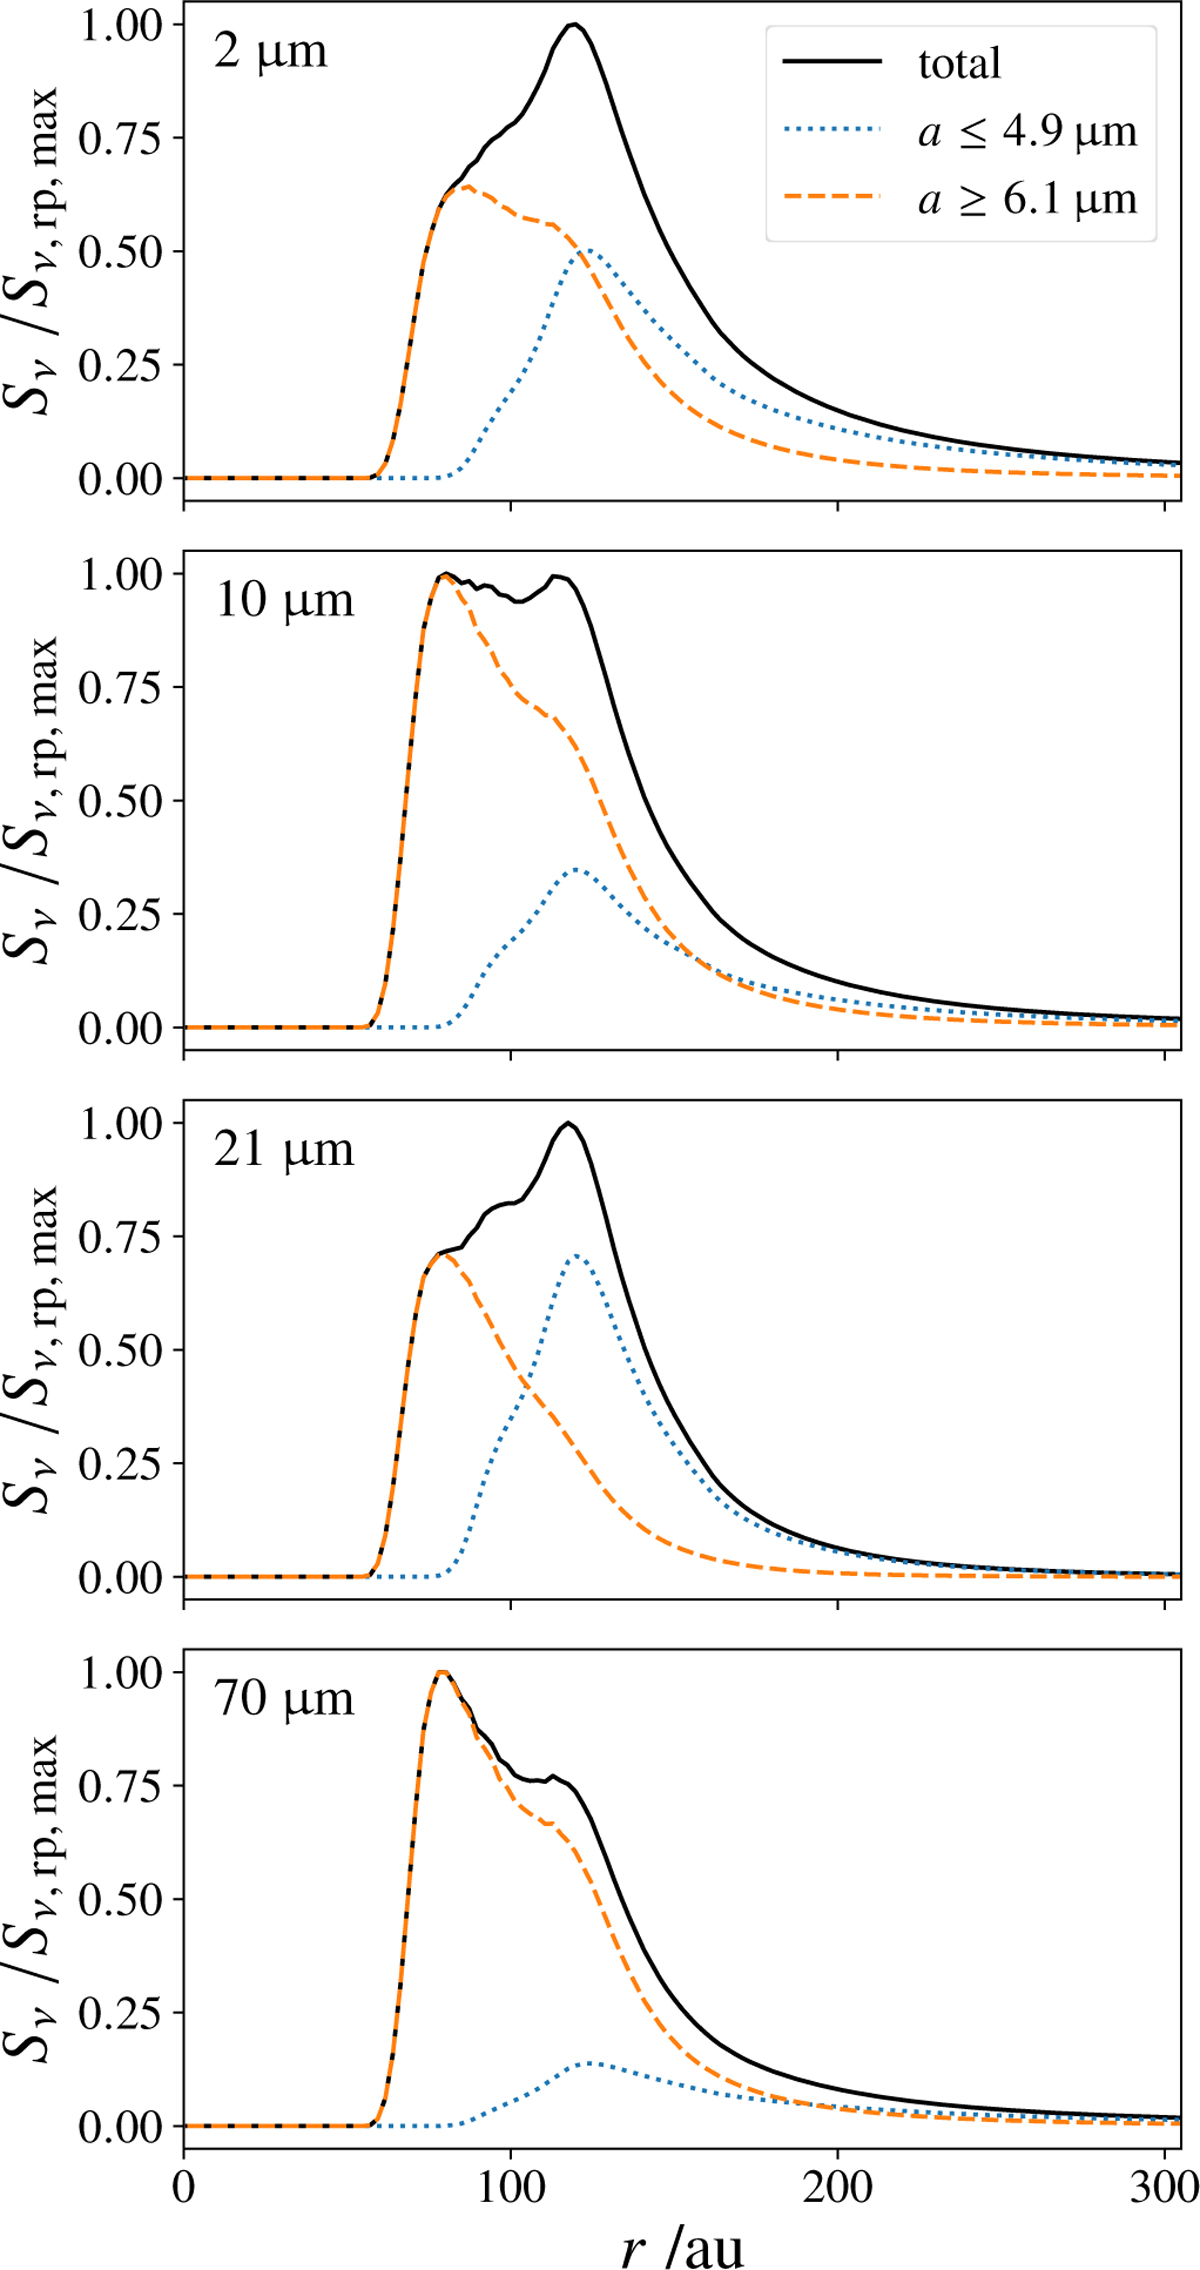
Radial brightness profiles normalized by their respective maximum value, Sv,rp,max, at the wavelengths 2 µm, 10 µm, 21 µm, and 70 µm of the system with the reference planetesimal belt n and the i-M2 inner perturber (n-i-M2). The dotted blue line shows the relative contribution of radiation from grains with radii s ≤ 4.9 µm, the dashed orange line of grains with radii s ≥ 6.1 µm, and the solid black line shows the total emission as the sum of the two fractions. The radial profiles of each wavelength are normalized to the maximum value of the respective total brightness profile.
Current usage metrics show cumulative count of Article Views (full-text article views including HTML views, PDF and ePub downloads, according to the available data) and Abstracts Views on Vision4Press platform.
Data correspond to usage on the plateform after 2015. The current usage metrics is available 48-96 hours after online publication and is updated daily on week days.
Initial download of the metrics may take a while.