| Issue |
A&A
Volume 669, January 2023
|
|
|---|---|---|
| Article Number | C2 | |
| Number of page(s) | 1 | |
| Section | Cosmology (including clusters of galaxies) | |
| DOI | https://doi.org/10.1051/0004-6361/202243074e | |
| Published online | 12 January 2023 | |
Linking a universal gas density profile to the core-excised X-ray luminosity in galaxy clusters up to z∼1.1 (Corrigendum)
1
Université Paris-Saclay, Université Paris Cité, CEA, CNRS, AIM de Paris-Saclay, 91191 Gif-sur-Yvette, France
e-mail: gabriel.pratt@cea.fr
2
HH Wills Physics Laboratory, University of Bristol, Tyndall Ave, Bristol BS8 1TL, UK
3
IRFU, CEA, Université Paris-Saclay, 91191 Gif-sur-Yvette, France
Key words: X-rays: galaxies: clusters / galaxies: clusters: intracluster medium / large-scale structure of Universe / errata, addenda
There were errors in two of the equations in our original publication (Pratt et al. 2022). The first error appears in Eq. (3), where the quantity in question should be 500 times the critical density of the Universe, and so it becomes

The second error appears in Eq. (18), where the numerical factor for the normalisation, f0, should have been
The gas mass fraction corresponding to this value of the normalisation is then fgas = 0.13 ± 0.01.
As a consequence of the above-mentioned points, the normalisation of the plots in Fig. 4 of Pratt et al. (2022) was also incorrect. The plots with the correct normalisation are shownbelow.
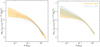 |
Fig. 1. Universal cluster ICM density profile. Left: Scaled density profiles of the SZE-selected clusters (grey points), overplotted with the best-fitting GNFW model with free evolution and mass dependence: ρgas/ρ500(R/R500)∝E(z)αz MαM with αz = 2.09 ± 0.02 and αM = 0.22 ± 0.01 (orange line). The model includes a radially varying intrinsic scatter term (orange envelope). Right: Comparison of the best-fitting model, defined on the SZE-selected sample, to the best-fitting model for the X-ray-selected REXCESS sample (light blue). Here, the points with error bars are the REXCESS sample. |
Acknowledgments
We thank S. Andreon for notifying us of the errors in the original article.
References
- Pratt, G. W., Arnaud, M., Maughan, B. J., & Melin, J. B. 2022, A&A, 665, A24 [NASA ADS] [CrossRef] [EDP Sciences] [Google Scholar]
© The Authors 2023
 Open Access article, published by EDP Sciences, under the terms of the Creative Commons Attribution License (https://creativecommons.org/licenses/by/4.0), which permits unrestricted use, distribution, and reproduction in any medium, provided the original work is properly cited.
This article is published in open access under the Subscribe-to-Open model. Subscribe to A&A to support open access publication.
All Figures
|
Fig. 1. Universal cluster ICM density profile. Left: Scaled density profiles of the SZE-selected clusters (grey points), overplotted with the best-fitting GNFW model with free evolution and mass dependence: ρgas/ρ500(R/R500)∝E(z)αz MαM with αz = 2.09 ± 0.02 and αM = 0.22 ± 0.01 (orange line). The model includes a radially varying intrinsic scatter term (orange envelope). Right: Comparison of the best-fitting model, defined on the SZE-selected sample, to the best-fitting model for the X-ray-selected REXCESS sample (light blue). Here, the points with error bars are the REXCESS sample. |
| In the text | |
Current usage metrics show cumulative count of Article Views (full-text article views including HTML views, PDF and ePub downloads, according to the available data) and Abstracts Views on Vision4Press platform.
Data correspond to usage on the plateform after 2015. The current usage metrics is available 48-96 hours after online publication and is updated daily on week days.
Initial download of the metrics may take a while.