Fig. B.1.
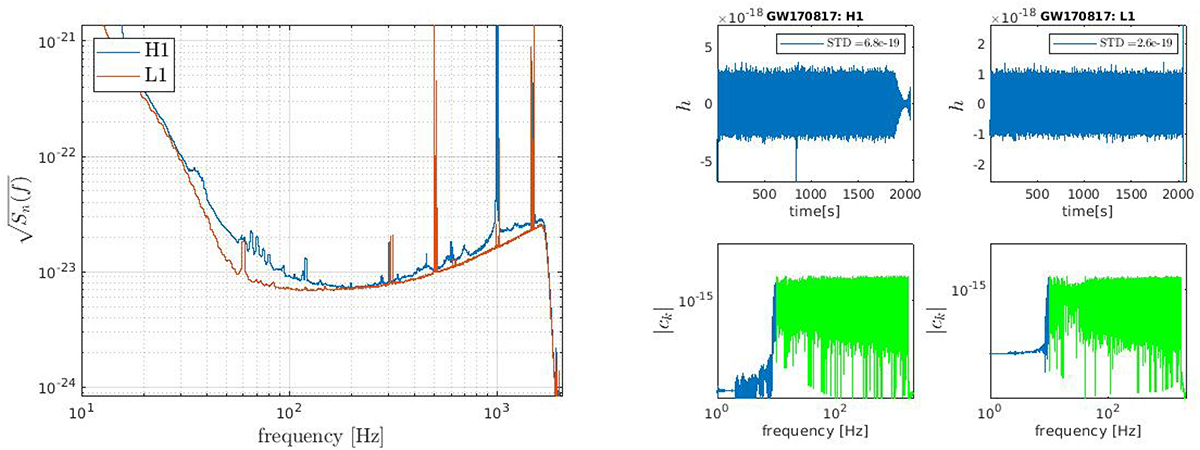
Download original image
(H1L1-detector spectral energy density Sn(f) for the T = 2048 s data snippet containing GW170817 following a band pass filter 10-1700 Hz (left panel). Violin modes appear prominently associated with the suspension of optics. Frequencies up to about 1700 Hz can be used in injection experiments. H1 and L1 detector noise is very similar though not identical during the GW170817 event. Whitening of H1 and L1 strain data by normalisation (B.1) produces flat spectra with lines suppressed (right panels).
Current usage metrics show cumulative count of Article Views (full-text article views including HTML views, PDF and ePub downloads, according to the available data) and Abstracts Views on Vision4Press platform.
Data correspond to usage on the plateform after 2015. The current usage metrics is available 48-96 hours after online publication and is updated daily on week days.
Initial download of the metrics may take a while.