Fig. 5.
Download original image
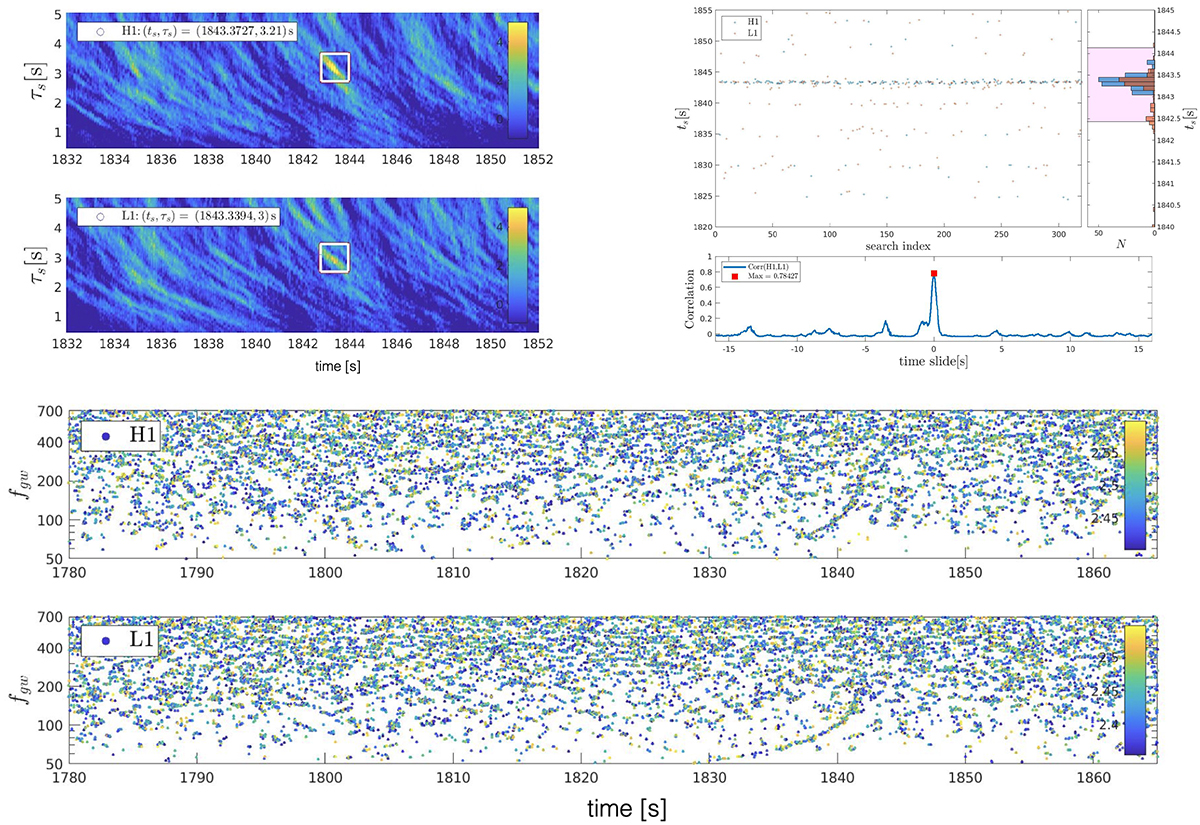
Sample of (![]() ) identified in χ-image analysis of individual H1- and L1-spectrograms (top-left panels), representing two elements from a total of nm = 320 H1- and L1-spectrograms (lower panels). Peak values indicated (white rectangles) have
) identified in χ-image analysis of individual H1- and L1-spectrograms (top-left panels), representing two elements from a total of nm = 320 H1- and L1-spectrograms (lower panels). Peak values indicated (white rectangles) have ![]() (H1) and
(H1) and ![]() (L1). Over the snippet of T = 2048 s of H1L1-data, time differences
(L1). Over the snippet of T = 2048 s of H1L1-data, time differences ![]() and
and ![]() identified by local maxima of
identified by local maxima of ![]() over the 64 segments of 32 s and 320 trials of H1- and L1-spectrograms are, as expected, uncorrelated, evidenced by a correlation coefficient ρ[ts], [τs] = 1.29 × 10⁻⁴. (Right-top-panels) PDF1(ts) and PDF2(ts) of H1 and, respectively, L1 are centered around ts − tm = (0.92±0.09) s and τs = (3.00±0.09) s. Binning over δtres = 0.025 s, cross-correlation of the two PDFs (over each segment covering H1L1-data over T = 2048 s) shows a global maximum in segment 58 containing GW170817 consistent with zero time difference within δtres = 0.025 s.
over the 64 segments of 32 s and 320 trials of H1- and L1-spectrograms are, as expected, uncorrelated, evidenced by a correlation coefficient ρ[ts], [τs] = 1.29 × 10⁻⁴. (Right-top-panels) PDF1(ts) and PDF2(ts) of H1 and, respectively, L1 are centered around ts − tm = (0.92±0.09) s and τs = (3.00±0.09) s. Binning over δtres = 0.025 s, cross-correlation of the two PDFs (over each segment covering H1L1-data over T = 2048 s) shows a global maximum in segment 58 containing GW170817 consistent with zero time difference within δtres = 0.025 s.
Current usage metrics show cumulative count of Article Views (full-text article views including HTML views, PDF and ePub downloads, according to the available data) and Abstracts Views on Vision4Press platform.
Data correspond to usage on the plateform after 2015. The current usage metrics is available 48-96 hours after online publication and is updated daily on week days.
Initial download of the metrics may take a while.