Fig. 4.
Download original image
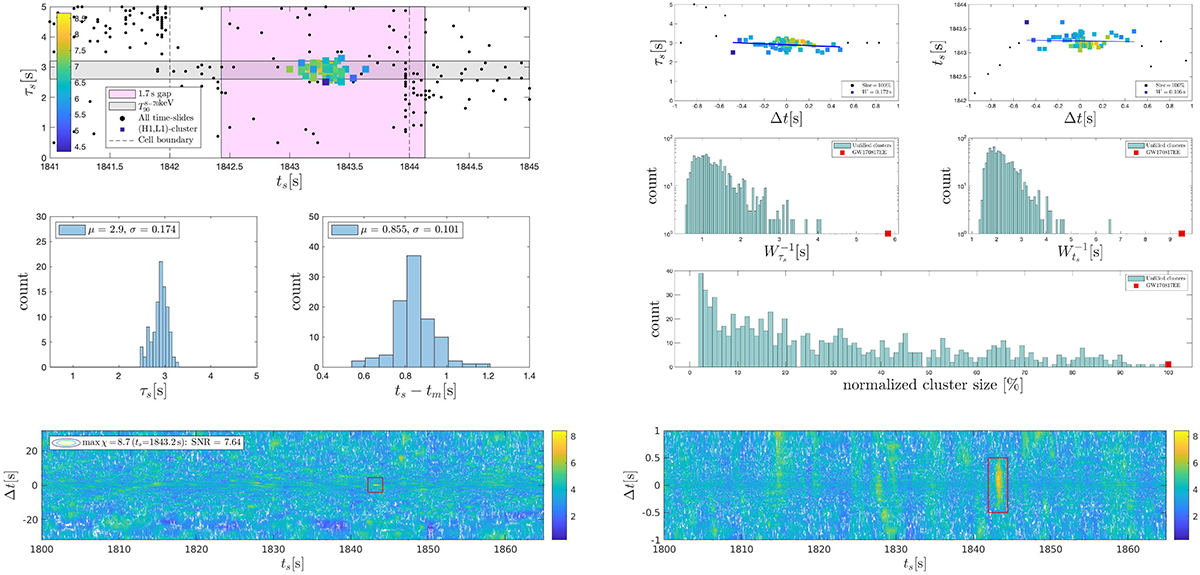
Joint PDF(ts, τs) in Eq. (7) from merged (H1,L1)-spectrograms by χ-image analysis following time-slide analysis (top-left panels). Clustering is seen in the (ts, τs)-plane about a global maximum ![]() in the extended foreground over small time-slides Eq. (11). (The peak in the cluster in extended foreground (S1) is slightly larger than what is seen in conventional foreground (S0).) This cluster is extremal in the sense of Eq. (13). Tracing produces PDF’s of τs and the delay time ts − tm, where tm is the merger time of GW170817. There is notable consistency in τs with the duration
in the extended foreground over small time-slides Eq. (11). (The peak in the cluster in extended foreground (S1) is slightly larger than what is seen in conventional foreground (S0).) This cluster is extremal in the sense of Eq. (13). Tracing produces PDF’s of τs and the delay time ts − tm, where tm is the merger time of GW170817. There is notable consistency in τs with the duration ![]() s of GRB170817A (Pozanenko et al. 2018), expected from the timescale of black hole spin-down in interaction with surrounding high-density matter following gravitational collapse of the hyper-massive neutron star in the immediate aftermath of this merger. Clustering in τs and ts as a function of time-slide Δt in the post-merger emission to GW170817 extracted from (H1,L1)-spectrograms merged by frequency coincidences |fH1 − fL1| < 10 Hz (top-right panels). Contour plots of
s of GRB170817A (Pozanenko et al. 2018), expected from the timescale of black hole spin-down in interaction with surrounding high-density matter following gravitational collapse of the hyper-massive neutron star in the immediate aftermath of this merger. Clustering in τs and ts as a function of time-slide Δt in the post-merger emission to GW170817 extracted from (H1,L1)-spectrograms merged by frequency coincidences |fH1 − fL1| < 10 Hz (top-right panels). Contour plots of ![]() (maximal over τs, fs, f0) over all time-slides Δt ϵ [−32, 32] s (S0 − 2) in the bottom panels. The right panel zooms in on Δt ϵ [−1, 1] s, highlighting clustering within Δt ϵ [−τ, τ] set by the intermediate time scale τ ≃ 0.5 s of our template bank. Crucially, this cluster is extremal in the sense of Eq. (13) in extended foreground (S1).
(maximal over τs, fs, f0) over all time-slides Δt ϵ [−32, 32] s (S0 − 2) in the bottom panels. The right panel zooms in on Δt ϵ [−1, 1] s, highlighting clustering within Δt ϵ [−τ, τ] set by the intermediate time scale τ ≃ 0.5 s of our template bank. Crucially, this cluster is extremal in the sense of Eq. (13) in extended foreground (S1).
Current usage metrics show cumulative count of Article Views (full-text article views including HTML views, PDF and ePub downloads, according to the available data) and Abstracts Views on Vision4Press platform.
Data correspond to usage on the plateform after 2015. The current usage metrics is available 48-96 hours after online publication and is updated daily on week days.
Initial download of the metrics may take a while.