Fig. 9
Download original image
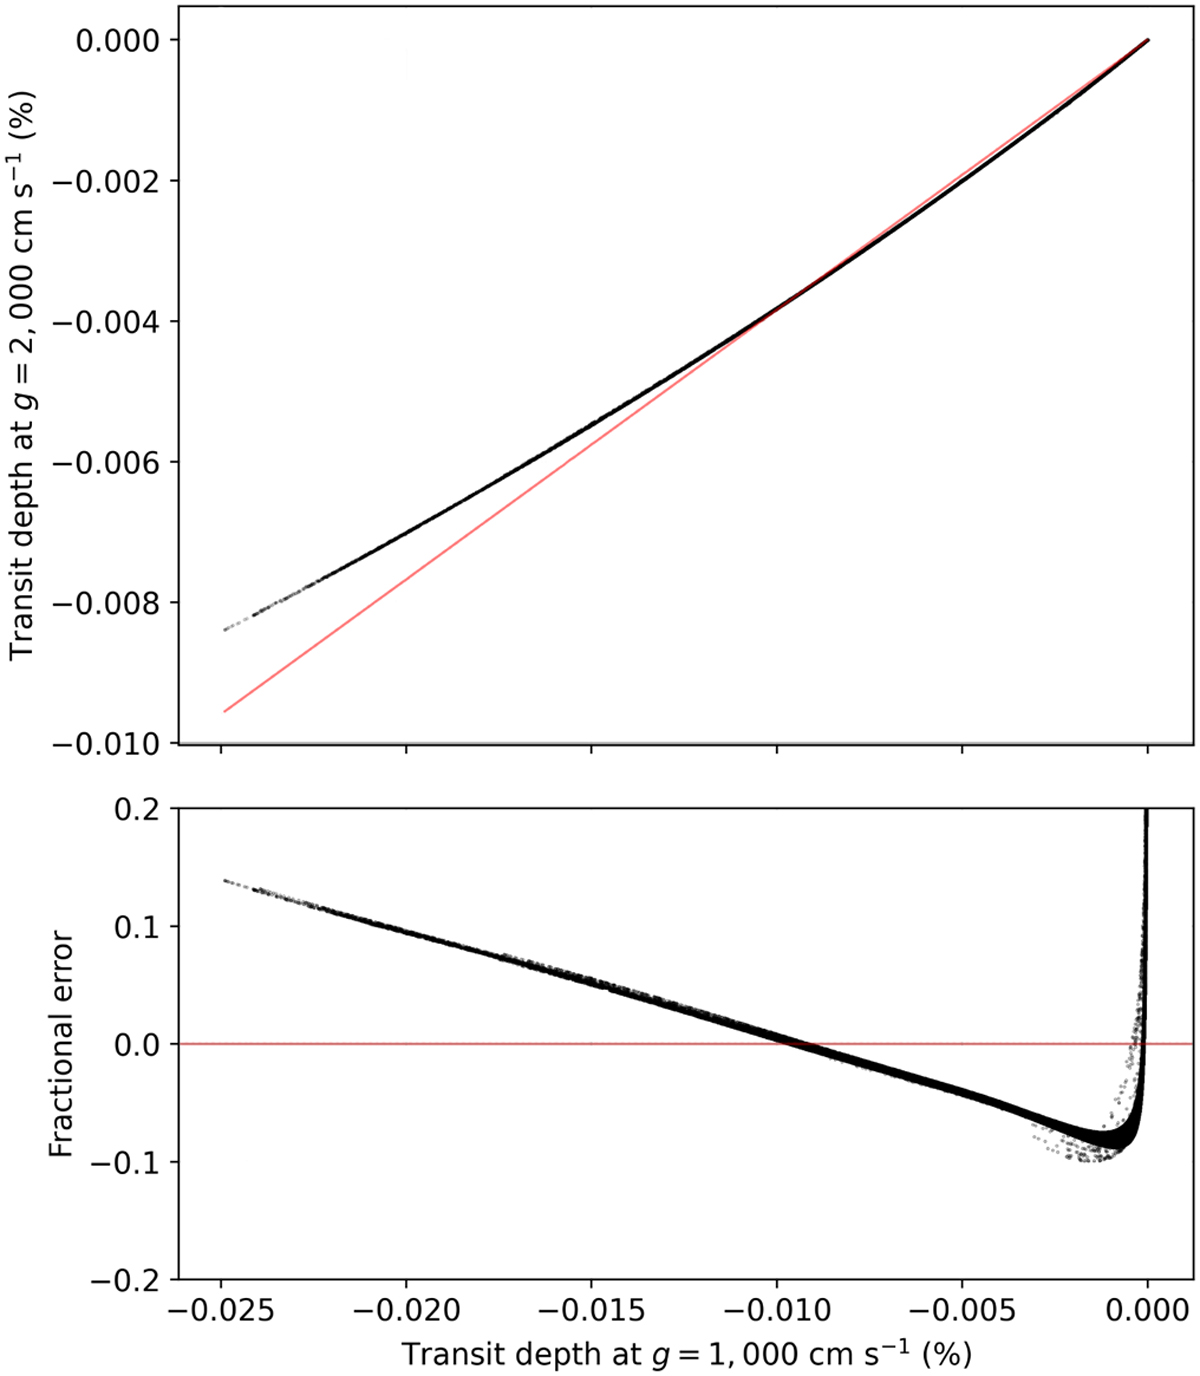
Template of neutral iron computed at two different values for the surface gravity, g, plotted against itself (top panel) and their relative differences (bottom panel). To first order, a change in gravity can be represented by a constant scaling (dashed line, linear fit). Departures of up to 15% occur for the weakest and strongest lines, which span a multitude of pressure scale heights. However, we find that they cause differences in the strength of the cross-correlation of no more than 0.5%.
Current usage metrics show cumulative count of Article Views (full-text article views including HTML views, PDF and ePub downloads, according to the available data) and Abstracts Views on Vision4Press platform.
Data correspond to usage on the plateform after 2015. The current usage metrics is available 48-96 hours after online publication and is updated daily on week days.
Initial download of the metrics may take a while.