Fig. 8
Download original image
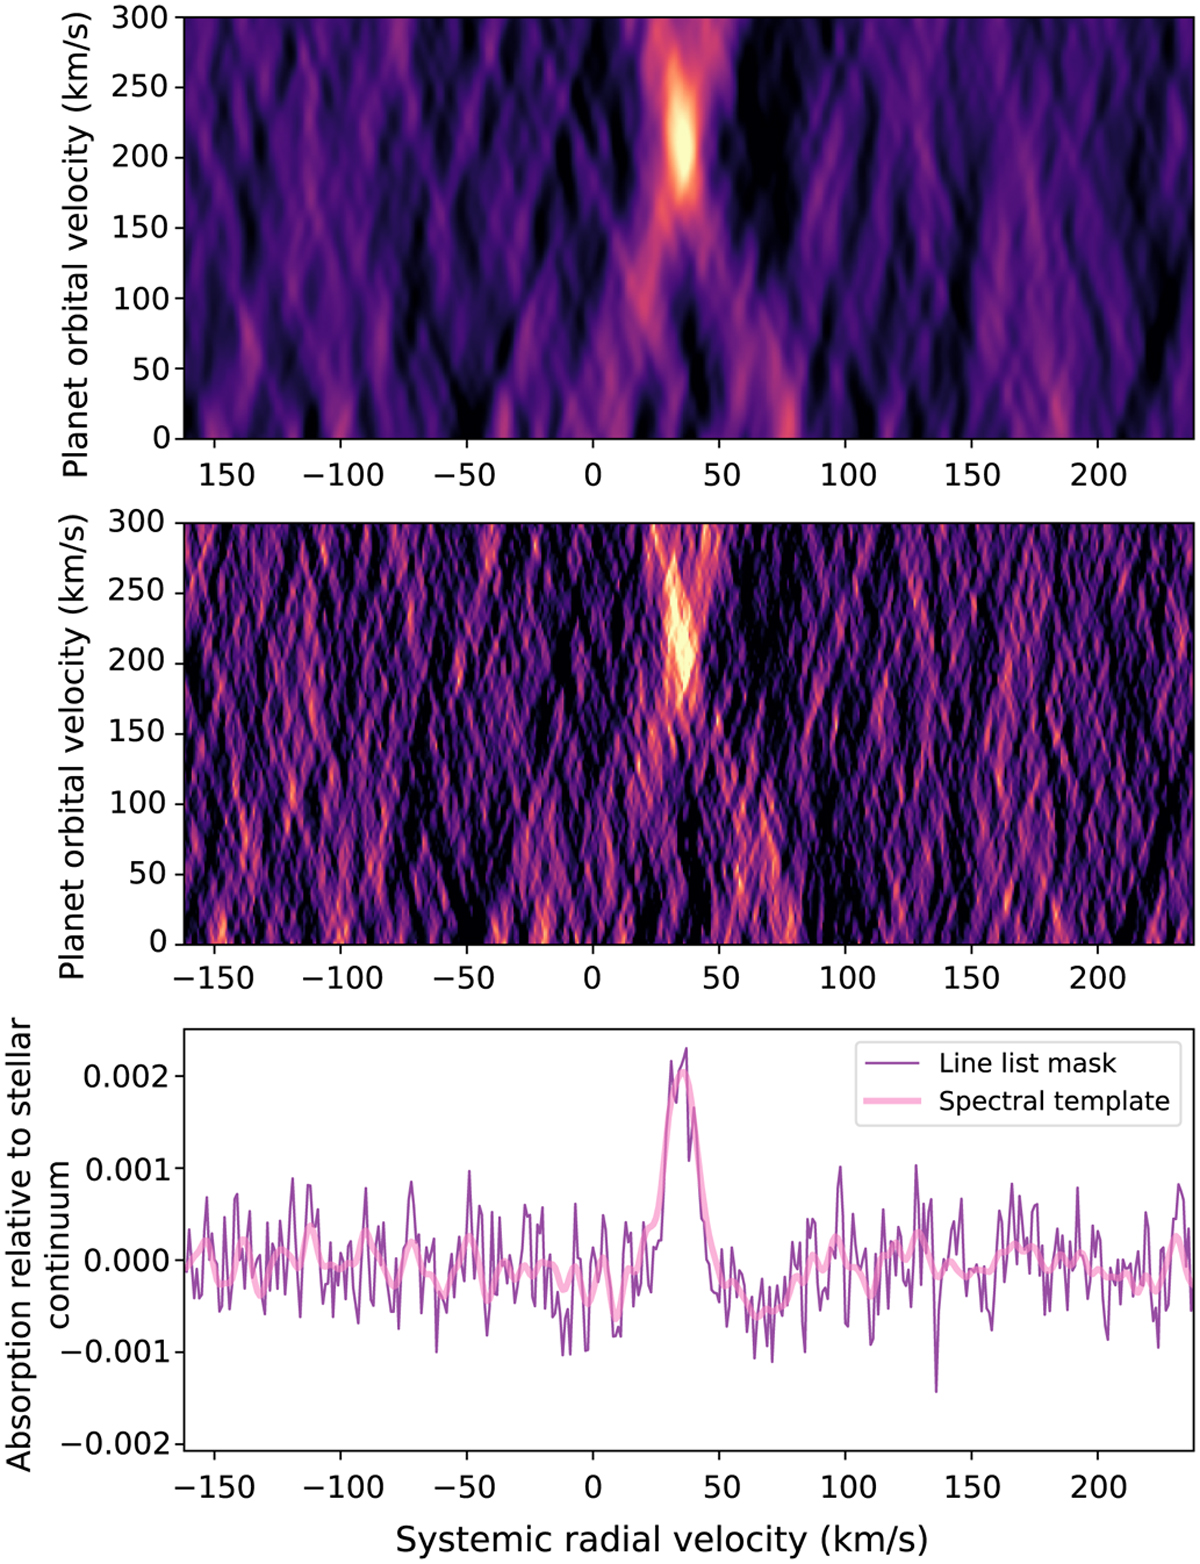
Cross-correlation diagrams integrated over a range of orbital velocities, producing velocity-velocity maps typically shown in similar studies based on cross-correlation spectroscopy. These maps were derived using either the spectral template (top panel) or the line mask (middle panel). The cross-correlation function is sampled in steps of 1 km s−1 in systemic radial velocity and orbital velocity. The cross-correlation functions integrated in the rest frame of the planet (assuming an orbital velocity of 221 km s−1, bottom panel) demonstrate that the line mask approach results in an equivalent, but higher-resolution, measurement of the Fe absorption line.
Current usage metrics show cumulative count of Article Views (full-text article views including HTML views, PDF and ePub downloads, according to the available data) and Abstracts Views on Vision4Press platform.
Data correspond to usage on the plateform after 2015. The current usage metrics is available 48-96 hours after online publication and is updated daily on week days.
Initial download of the metrics may take a while.