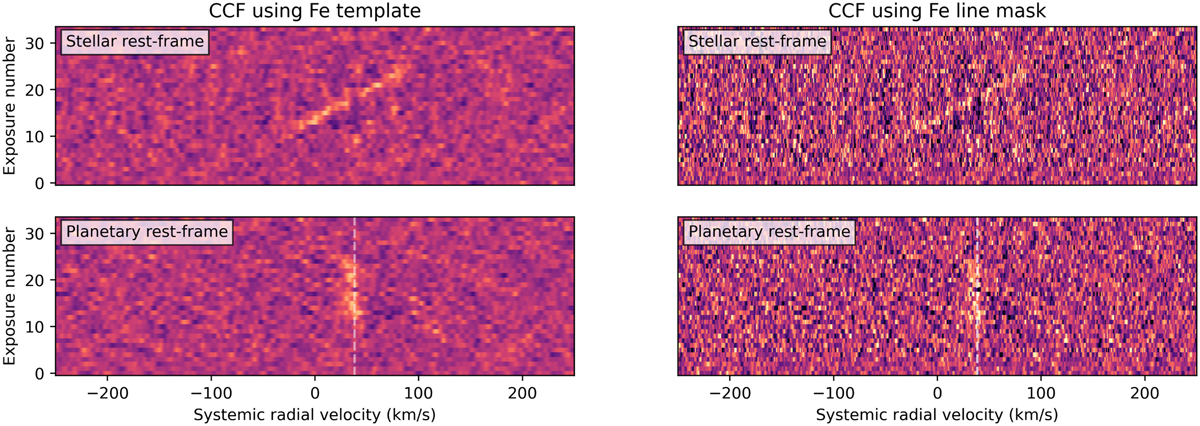
Fig. 7
Download original image
Cross-correlation diagrams showing Fe absorption in the transmission spectrum of WASP-121 b, data published previously in Hoeijmakers et al. (2020b). The cross-correlation function is evaluated using either a spectral template assuming an isothermal atmosphere of 2500 K (left panels) or a line mask (rightpanels), derived from the template. The cross-correlation function is sampled in steps of 1 km s−1 in systemic radial velocity for each exposure in the time series, and the cross-correlation functions of the second and third night of observations were interpolated onto the phase range of the first night, allowing them to be co-added to increase the signal-to-noise. The cross-correlation functions in the top panels are left in the stellar rest frame, while those in the bottom panels are shifted to the planetary rest frame (assuming an orbital velocity of 221 km s−1). The dashed vertical line indicates the systemic radial velocity, which is equivalent to the rest-frame velocity of the planet.
Current usage metrics show cumulative count of Article Views (full-text article views including HTML views, PDF and ePub downloads, according to the available data) and Abstracts Views on Vision4Press platform.
Data correspond to usage on the plateform after 2015. The current usage metrics is available 48-96 hours after online publication and is updated daily on week days.
Initial download of the metrics may take a while.