Fig. 6
Download original image
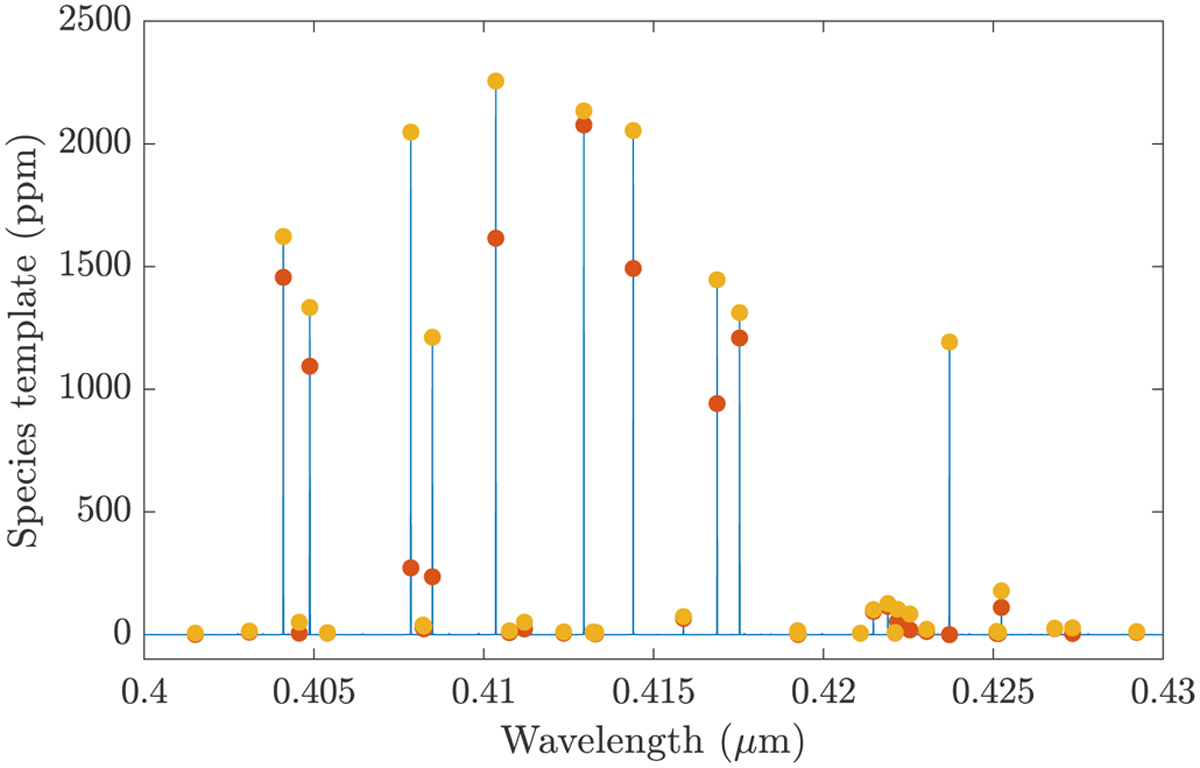
Example of a line mask of Y at an atmospheric temperature of 4000 K. The blue line represents the single-species template from Fig. 3. Orange circles denote the detected line peaks and the corresponding line heights. The red circles represent the line peaks in the subtracted template. As can be noticed, many lines are significantly down-weighted or even totally absent due to being covered by other species.
Current usage metrics show cumulative count of Article Views (full-text article views including HTML views, PDF and ePub downloads, according to the available data) and Abstracts Views on Vision4Press platform.
Data correspond to usage on the plateform after 2015. The current usage metrics is available 48-96 hours after online publication and is updated daily on week days.
Initial download of the metrics may take a while.