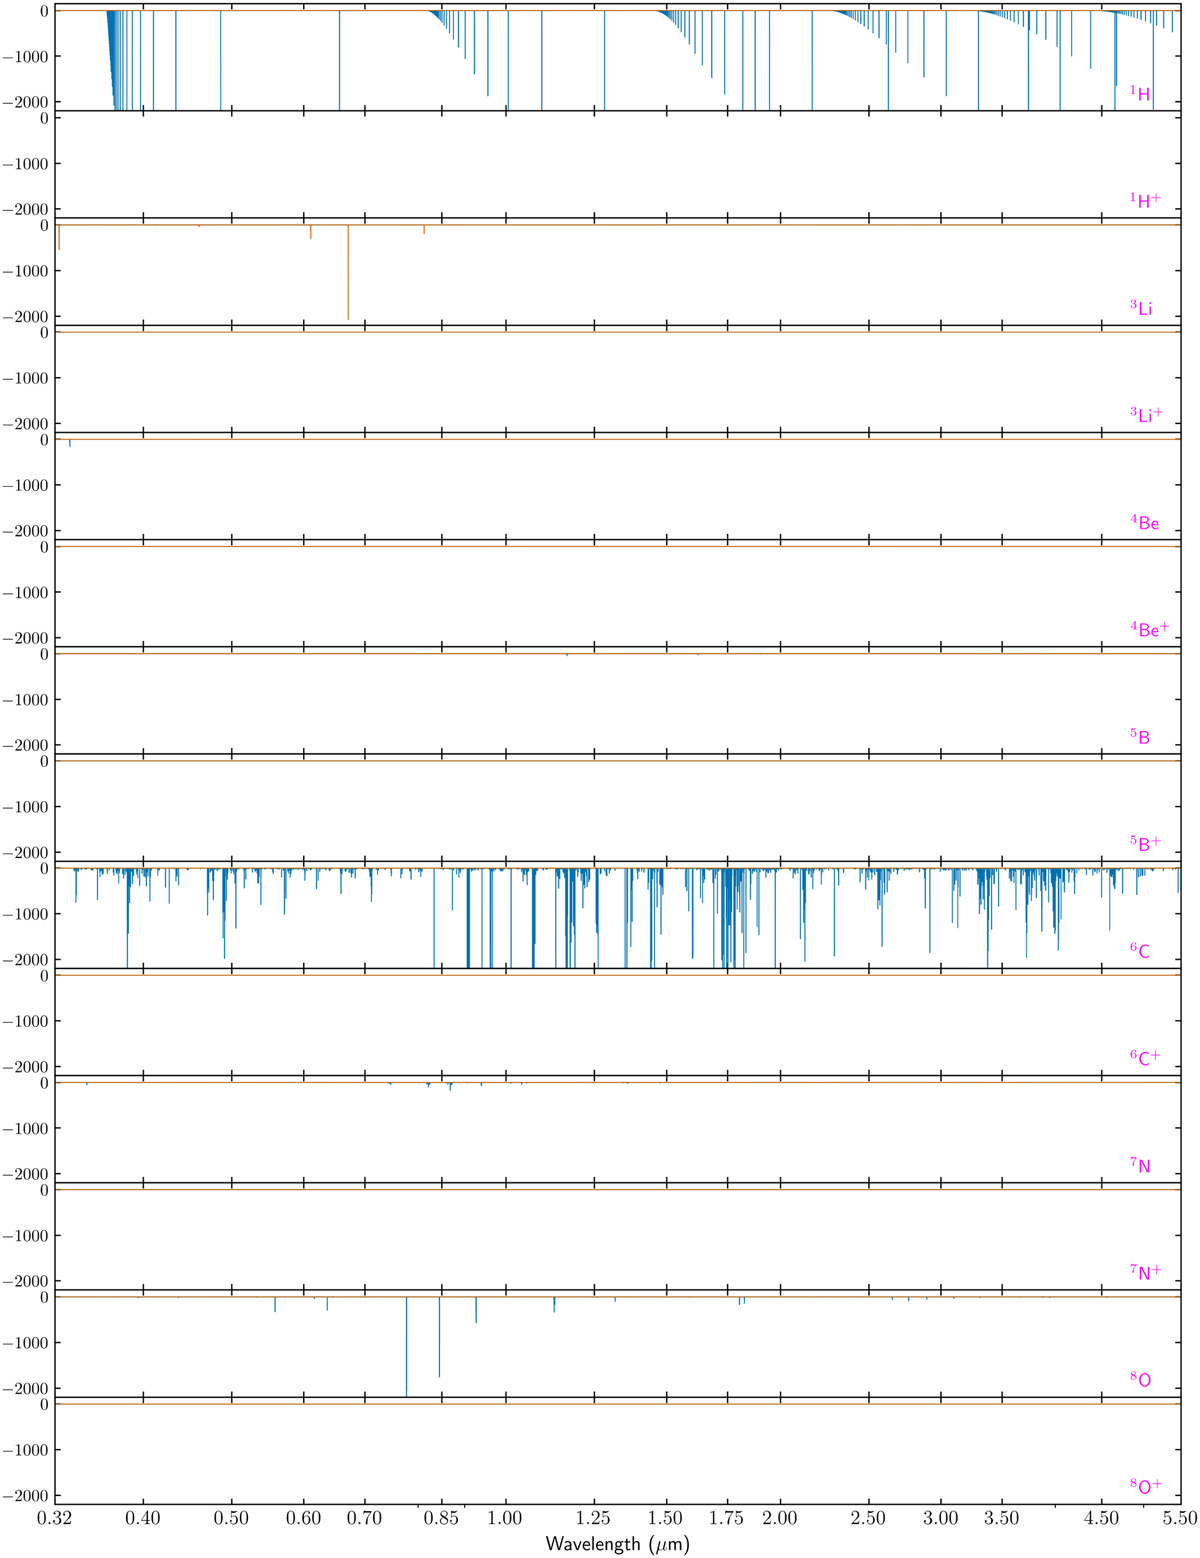
Fig. A.2
Download original image
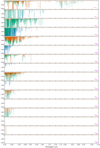
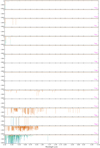
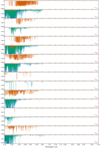
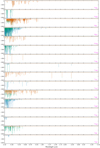
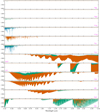
Cross-correlation templates of all atoms, ions, and molecules considered in this study. The plots show negative transit depth above the spectral continuum (−dt) of a 1.5 RJ planet orbiting a 1 R⊙ star in ppm as a function of wavelength. Templates for three different temperatures are depicted: 5000 K (blue), 3000 K (green), and 2000 K (orange). Figures without a line symbolise species where either no line list data or thermochemical data are available.
Current usage metrics show cumulative count of Article Views (full-text article views including HTML views, PDF and ePub downloads, according to the available data) and Abstracts Views on Vision4Press platform.
Data correspond to usage on the plateform after 2015. The current usage metrics is available 48-96 hours after online publication and is updated daily on week days.
Initial download of the metrics may take a while.