Fig. 1
Download original image
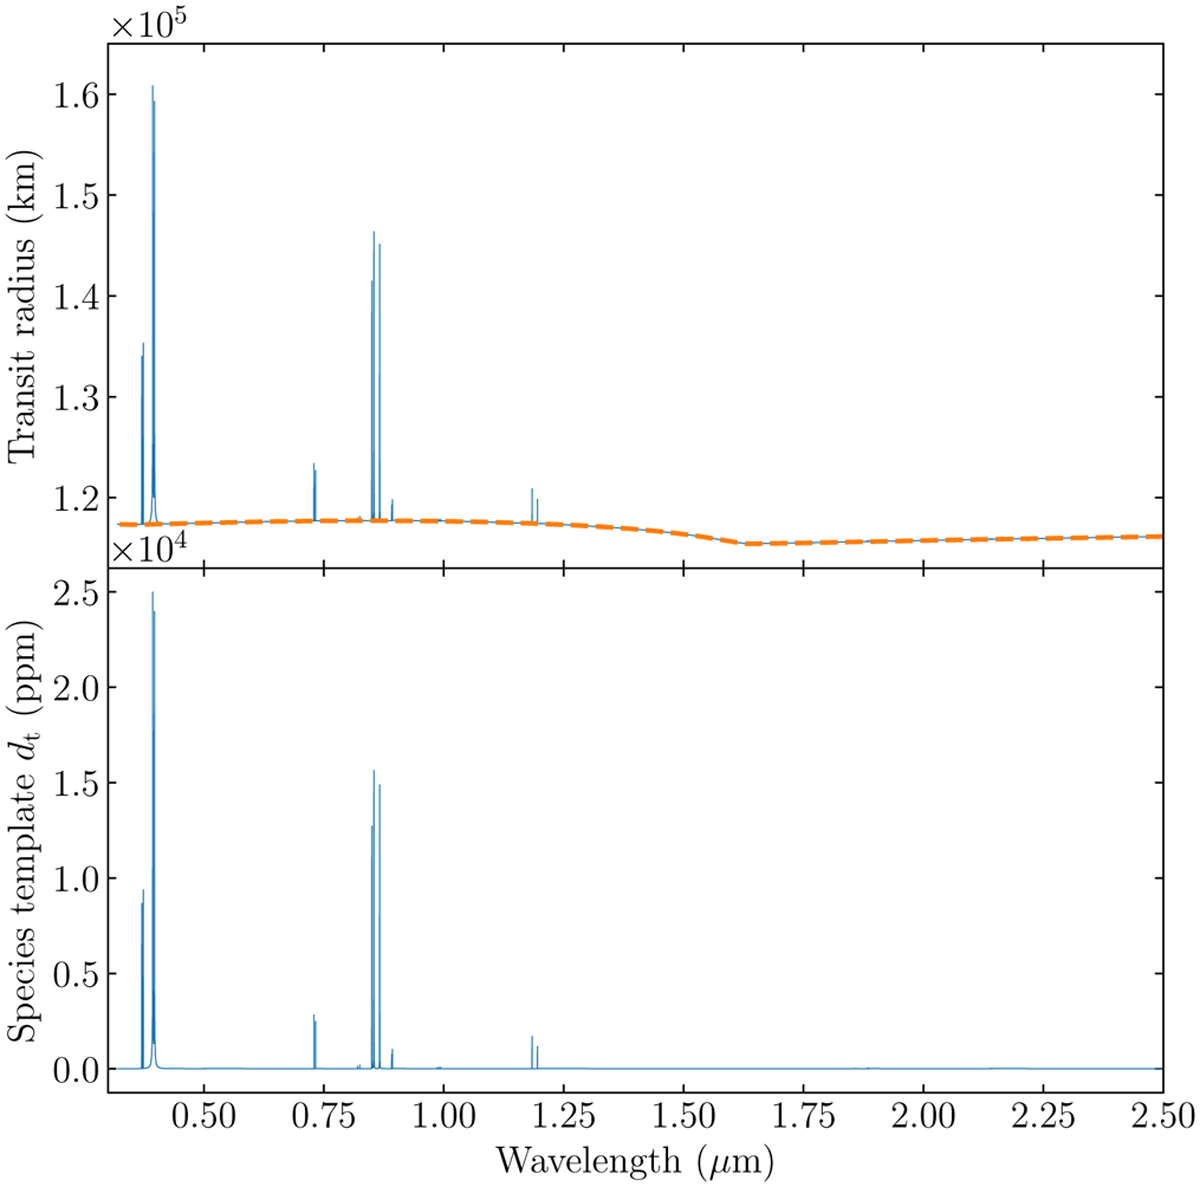
Example of a template construction of Ca+ at an atmospheric temperature of 4000 K. The upper panel shows the transmission spectrum with Ca+ and additional continuum-opacity species (blue line), as well as one only containing the continuum-forming species (dashed orange line). The lower panel depicts the final template, created by subtracting the continuum and the Ca+ spectra from the top panel.
Current usage metrics show cumulative count of Article Views (full-text article views including HTML views, PDF and ePub downloads, according to the available data) and Abstracts Views on Vision4Press platform.
Data correspond to usage on the plateform after 2015. The current usage metrics is available 48-96 hours after online publication and is updated daily on week days.
Initial download of the metrics may take a while.