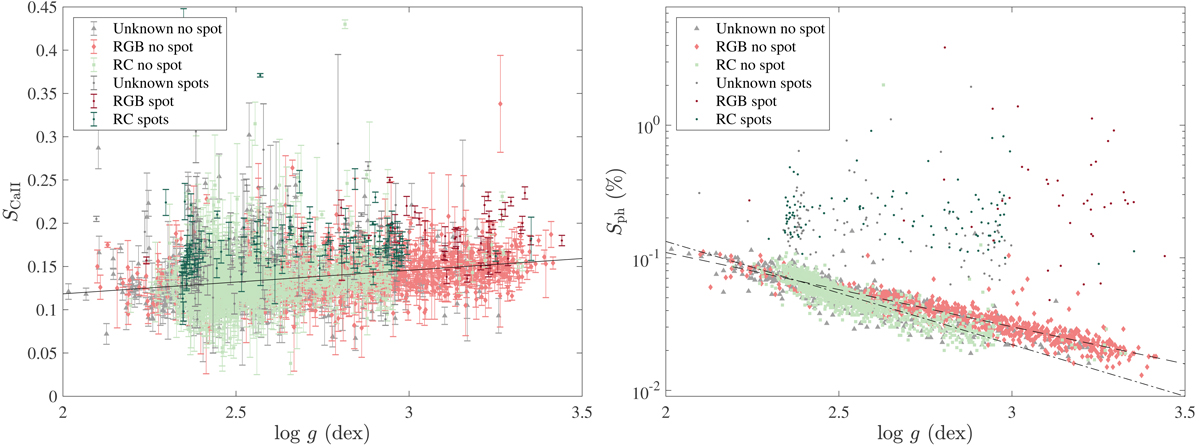
Fig. 5.
Download original image
Level of magnetic activity as a function of the surface gravity. Left: chromospheric emission index SCaII as a function of the surface gravity log g. The color indicates the evolution stage: gray symbols refer to stars with an unknown evolution stage; red symbols refer to RGB stars; and green symbols refer to RC stars. Stars with spot modulation are represented by darker dots than stars with no spot modulation. The symbol changes as a function of evolution stage for stars with no spot modulation. The black line represents the best linear fit given by Eq. (8) computed for the red giants where no spot modulation was detected by Gaulme et al. (2020). Right: corresponding figure for Sph as measured by Gaulme et al. (2020). The dashed and the dot-dashed black lines represent the best linear fit of Sph for RGB and RC stars, respectively, given by Eq. (6), computed for the red giants where no spot modulation was measured by Gaulme et al. (2020).
Current usage metrics show cumulative count of Article Views (full-text article views including HTML views, PDF and ePub downloads, according to the available data) and Abstracts Views on Vision4Press platform.
Data correspond to usage on the plateform after 2015. The current usage metrics is available 48-96 hours after online publication and is updated daily on week days.
Initial download of the metrics may take a while.