Fig. 4.
Download original image
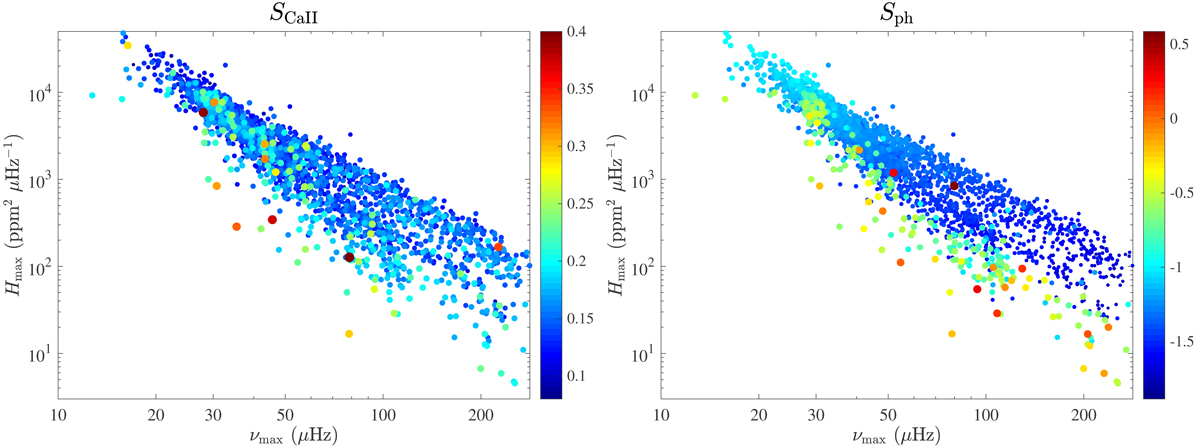
Impact of the level of magnetic activity on the height of oscillations. Left: chromospheric emission index SCaII (colorscale and symbol size) as a function of oscillations frequency at maximum amplitude vmax (x-axis) and height of the Gaussian envelope employed to model the oscillation excess power Hmax (y-axis) for the 3008 red giants observed both by Kepler and LAMOST, for which Sph and vmax are available. The colorscale was cut at 0.4 for readability purposes, despite a few points reaching SCaII ≈ 0.8. Right: corresponding figure for Sph as measured by Gaulme et al. (2020).
Current usage metrics show cumulative count of Article Views (full-text article views including HTML views, PDF and ePub downloads, according to the available data) and Abstracts Views on Vision4Press platform.
Data correspond to usage on the plateform after 2015. The current usage metrics is available 48-96 hours after online publication and is updated daily on week days.
Initial download of the metrics may take a while.