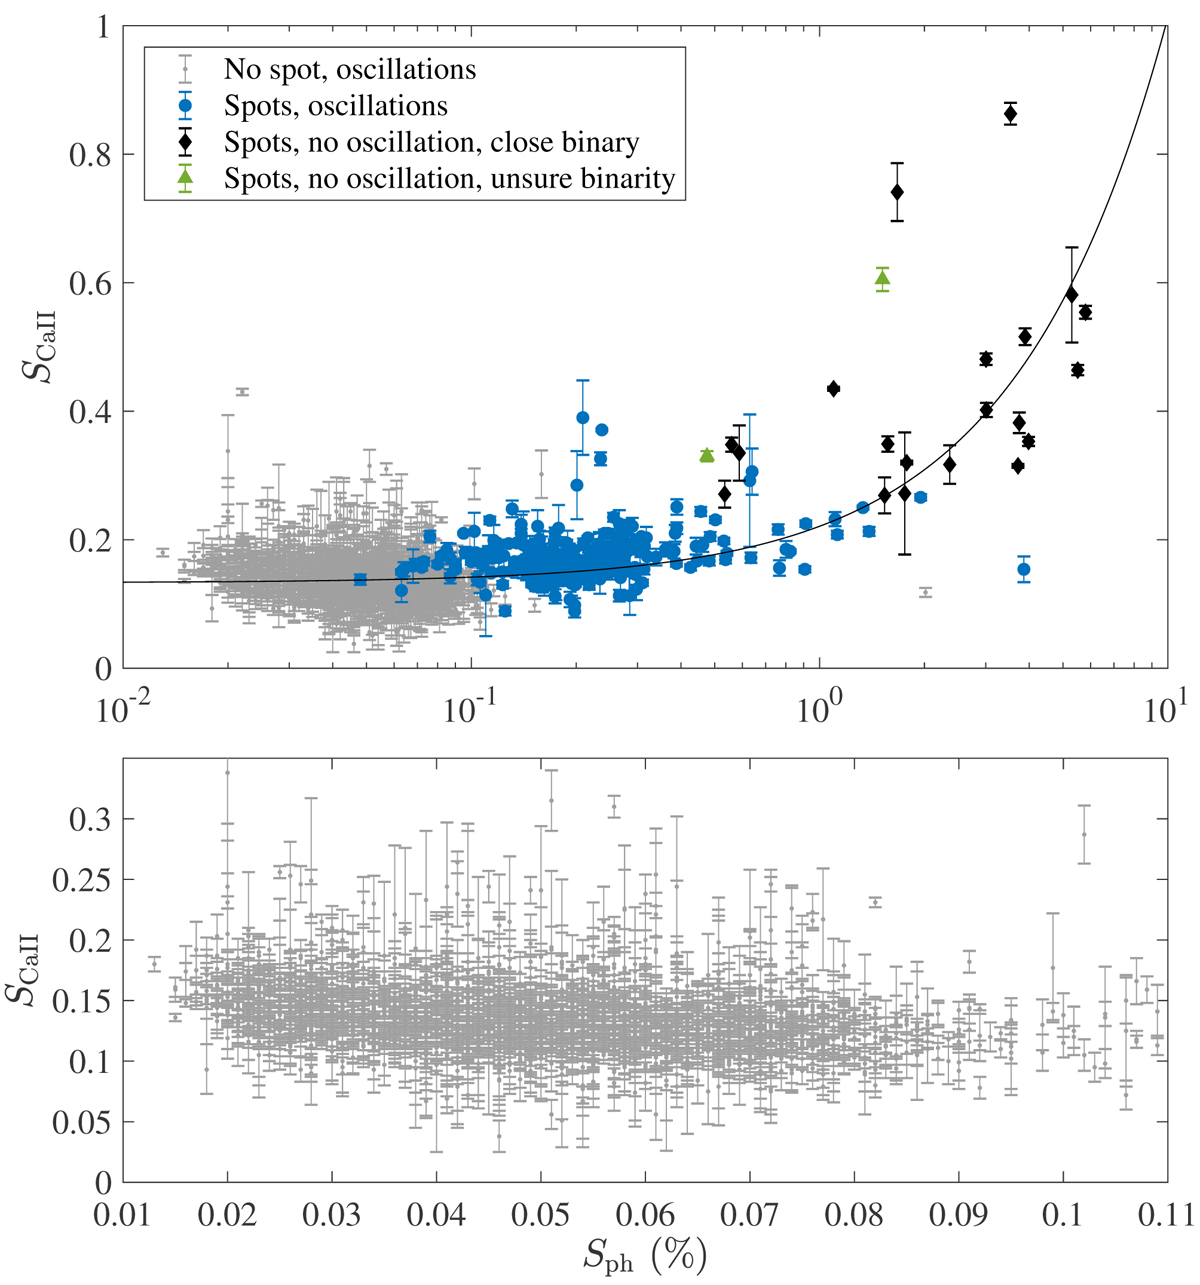
Fig. 3.
Download original image
Index of chromospheric emission SCaII as a function of photometric modulation Sph (in log scale). Upper panel: results for 3130 red giant stars observed by both LAMOST and Kepler, from the Gaulme et al. (2020) catalog. Gray symbols refer to regular inactive red giants (i.e., with no evidence of spot modulation) that display oscillations, while the other colors refer to photometrically active giants (i.e., exhibiting spot modulation): blue symbols refer to red giants with partially suppressed oscillations; black symbols refer to non-oscillating red giants in close binary systems; and green symbols refer to non-oscillating red giants with ambiguous binary versus single status. The gray line represents the best linear fit given by Eq. (5). Values of Sph are from Gaulme et al. (2020). Bottom panel: zoom on the upper panel for inactive red giants, with the x-axis in linear scale.
Current usage metrics show cumulative count of Article Views (full-text article views including HTML views, PDF and ePub downloads, according to the available data) and Abstracts Views on Vision4Press platform.
Data correspond to usage on the plateform after 2015. The current usage metrics is available 48-96 hours after online publication and is updated daily on week days.
Initial download of the metrics may take a while.