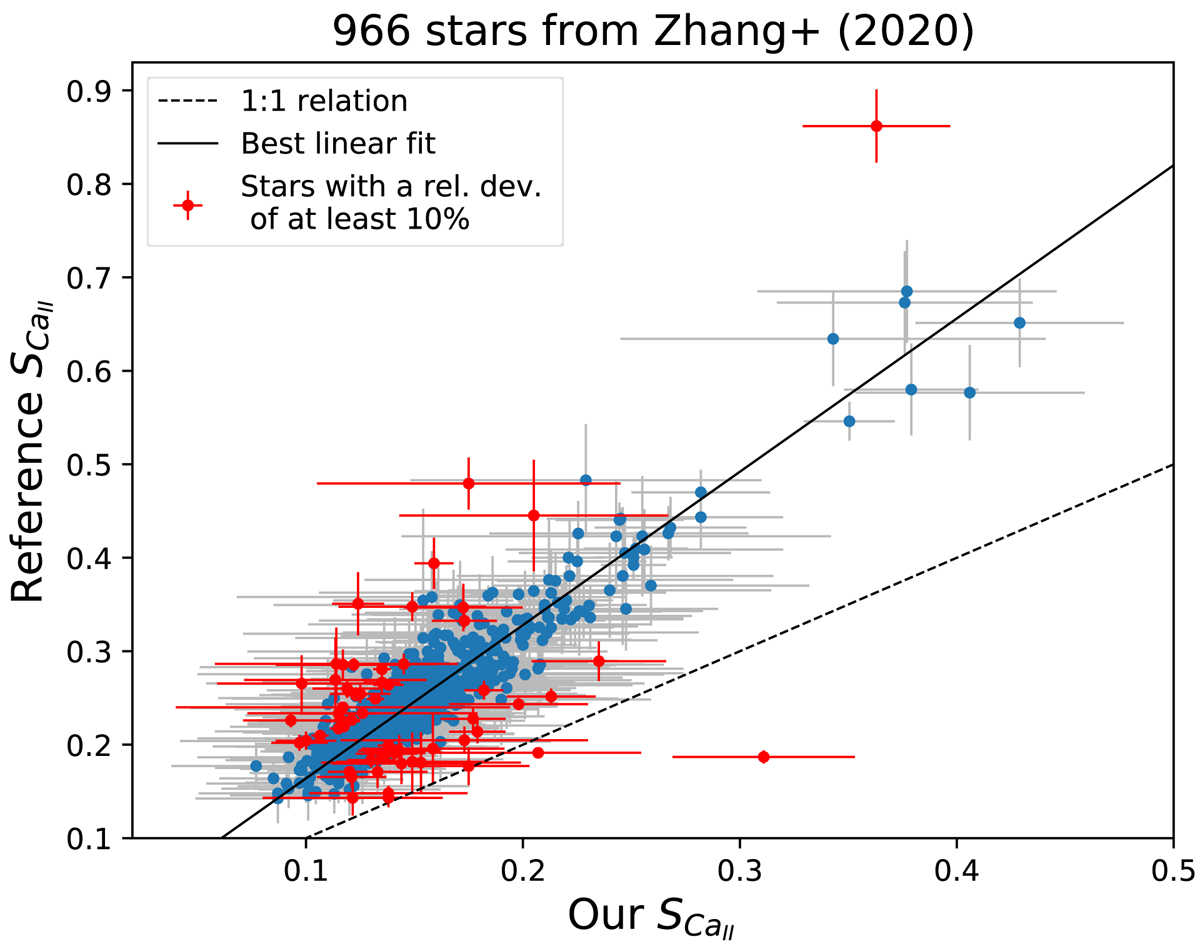
Fig. 2.
Download original image
Same as for Fig. 1, but for 966 red giants from Zhang et al. (2020) using LAMOST data. The best linear fit corresponds to a coefficient a = 1.64 ± 0.01. Stars with a relative deviation below 10% between S-index measurements are represented in blue, with error bars in gray for visualization purposes. Stars with a relative deviation of at least 10% between S-index measurements are represented in red, as well as the associated error bars.
Current usage metrics show cumulative count of Article Views (full-text article views including HTML views, PDF and ePub downloads, according to the available data) and Abstracts Views on Vision4Press platform.
Data correspond to usage on the plateform after 2015. The current usage metrics is available 48-96 hours after online publication and is updated daily on week days.
Initial download of the metrics may take a while.