Fig. 1.
Download original image
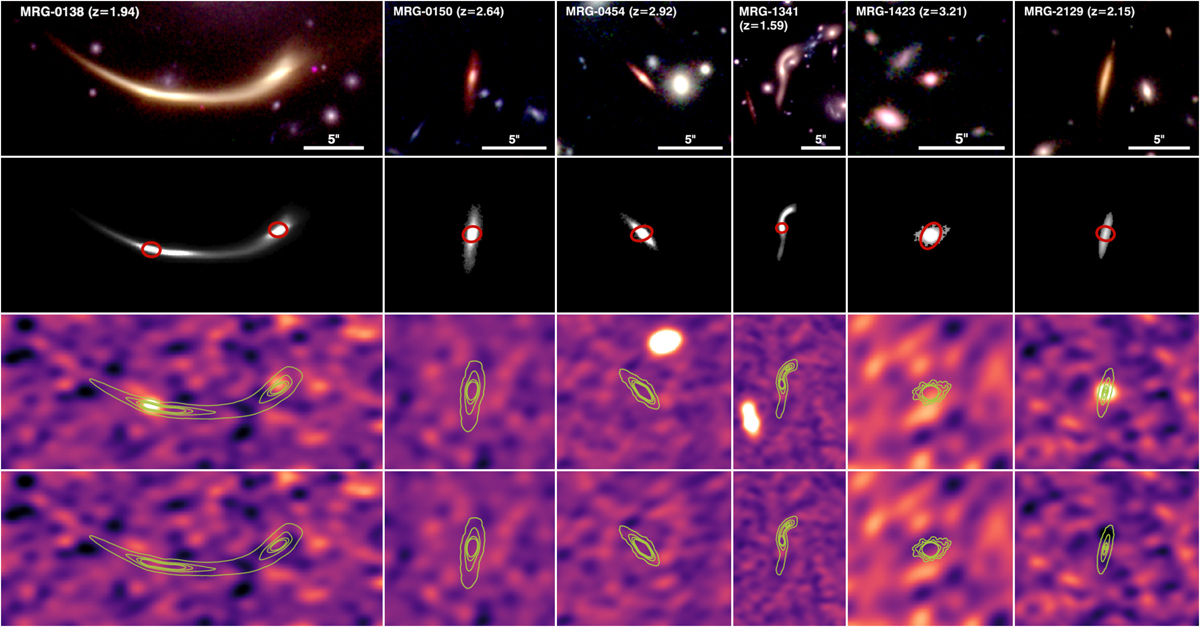
Cutouts of the six lensed QGs reanalyzed in this work. The rows, from top to bottom, show: color images (HST F160W, F140W, or F125W, and F105W) with scale bar; stellar light models with the ALMA synthesized beam shown as a red ellipse; and ALMA Band 6 continuum images and residuals after subtraction of the model, with the 1.6 μm light distribution shown as green contours.
Current usage metrics show cumulative count of Article Views (full-text article views including HTML views, PDF and ePub downloads, according to the available data) and Abstracts Views on Vision4Press platform.
Data correspond to usage on the plateform after 2015. The current usage metrics is available 48-96 hours after online publication and is updated daily on week days.
Initial download of the metrics may take a while.