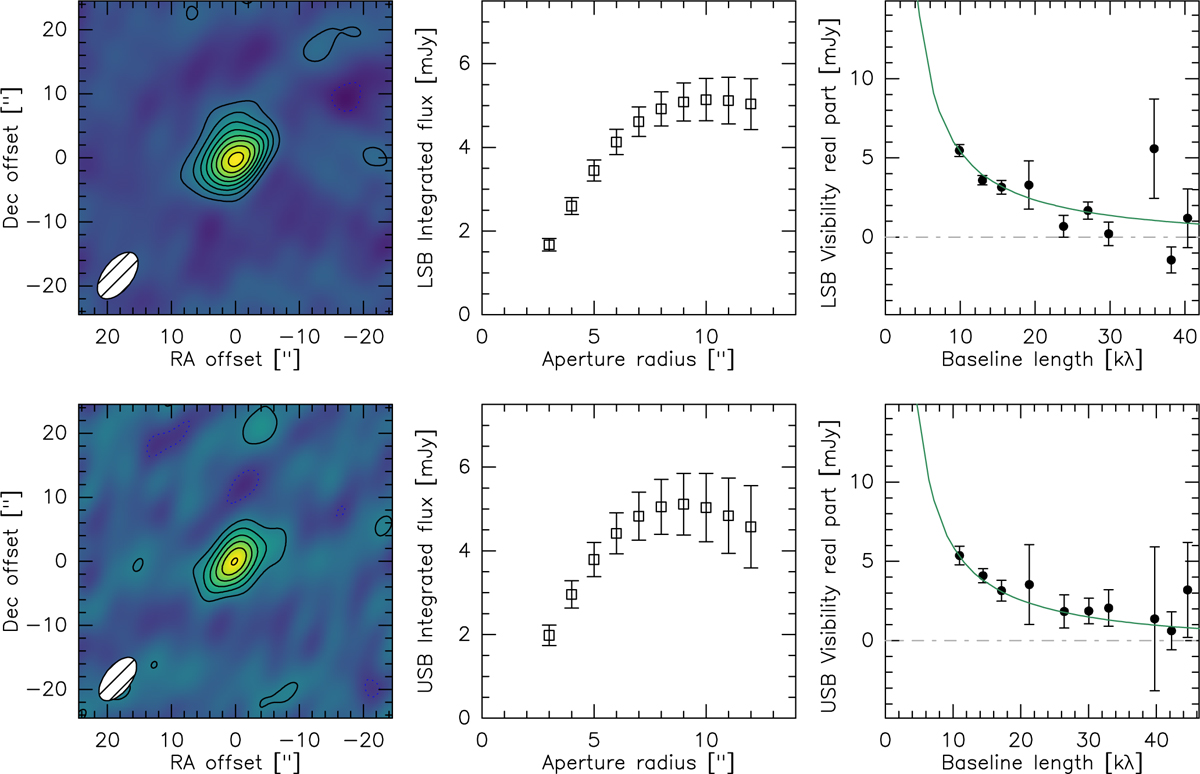
Fig. 20

Download original image
2 mm continuum emission of comet C/2020 F3 (NEOWISE) obtained on 22 July 2020 UT with NOEMA. Top and bottom panels refer to LSB (144.8 GHz) and USB (160.2 GHz) data, respectively. Left: interferometric maps with the synthesised interferometric beam (8.5 × 4.6″ in LSB and 8.0 × 4.1″ in USB) plotted in the bottom left corner. Contour intervals are 2 × σ, σ being the map rms noise (with σ = 0.19 and 0.28 mJy beam−1 in LSB and USB, respectively). Centre: total flux as a function of aperture radius. Right: real part of the visibilities as a function of baseline length expressed in units of kλ where λ is the wavelength (dots with errors); the curve shows the expected visibilities for an isotropic dust coma with a local density ∝ 1/r2, where r is the cometocentric distance.
Current usage metrics show cumulative count of Article Views (full-text article views including HTML views, PDF and ePub downloads, according to the available data) and Abstracts Views on Vision4Press platform.
Data correspond to usage on the plateform after 2015. The current usage metrics is available 48-96 hours after online publication and is updated daily on week days.
Initial download of the metrics may take a while.


