Fig. 17
Download original image
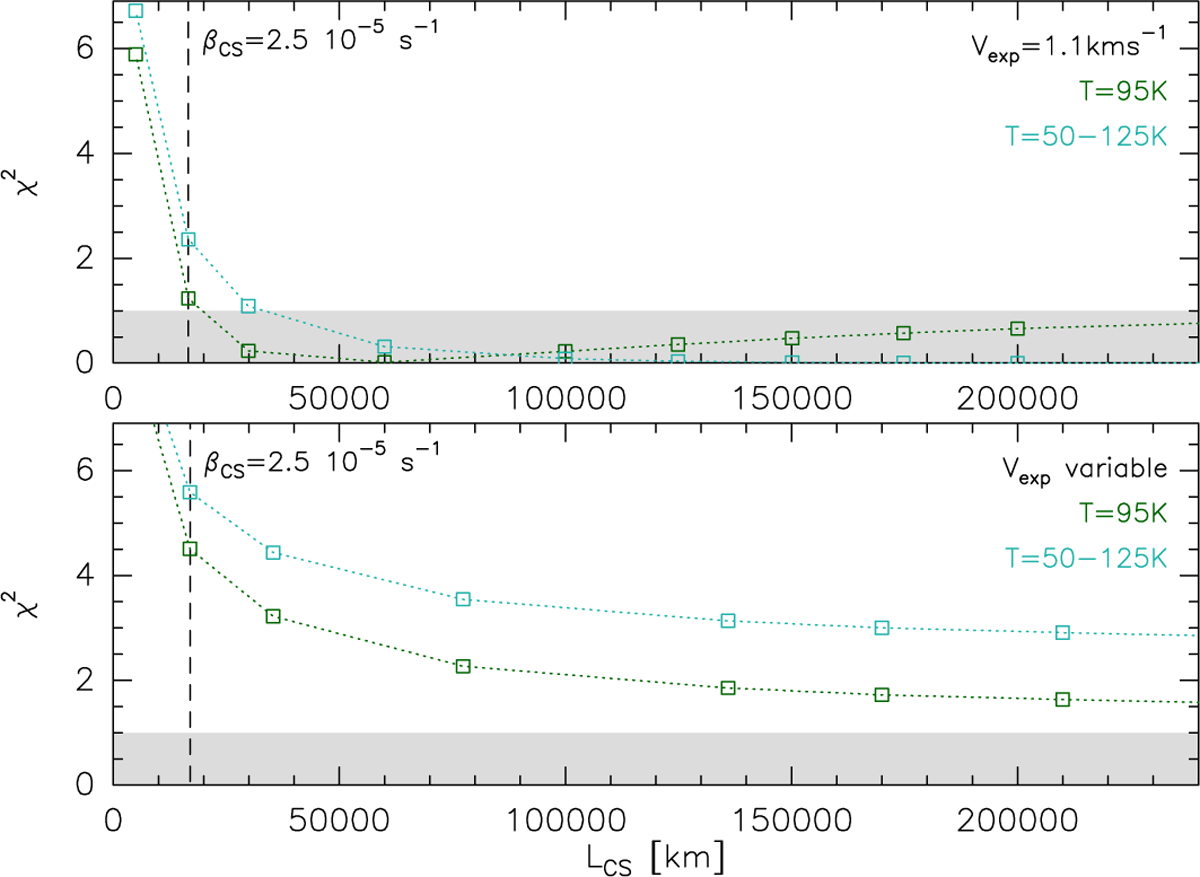
Relative deviation between simulated and observed ON–OFF-to-interferometric flux ratio, ![]() , as a function of CS lifetime. The different colour lines represent the different physical conditions assumed in the model, which are presented in Table 7 (T = 50–125 K′ for the Tvar temperature model). The grey shaded region corresponds to the 1-σ observed value. The CS default photo-dissociation rate (β0 = 2.5 × 10⁻⁵ s−1) is indicated by a vertical dashed line. CS is assumed to come from the photo-dissociation of CS2.
, as a function of CS lifetime. The different colour lines represent the different physical conditions assumed in the model, which are presented in Table 7 (T = 50–125 K′ for the Tvar temperature model). The grey shaded region corresponds to the 1-σ observed value. The CS default photo-dissociation rate (β0 = 2.5 × 10⁻⁵ s−1) is indicated by a vertical dashed line. CS is assumed to come from the photo-dissociation of CS2.
Current usage metrics show cumulative count of Article Views (full-text article views including HTML views, PDF and ePub downloads, according to the available data) and Abstracts Views on Vision4Press platform.
Data correspond to usage on the plateform after 2015. The current usage metrics is available 48-96 hours after online publication and is updated daily on week days.
Initial download of the metrics may take a while.