Fig. 14
Download original image
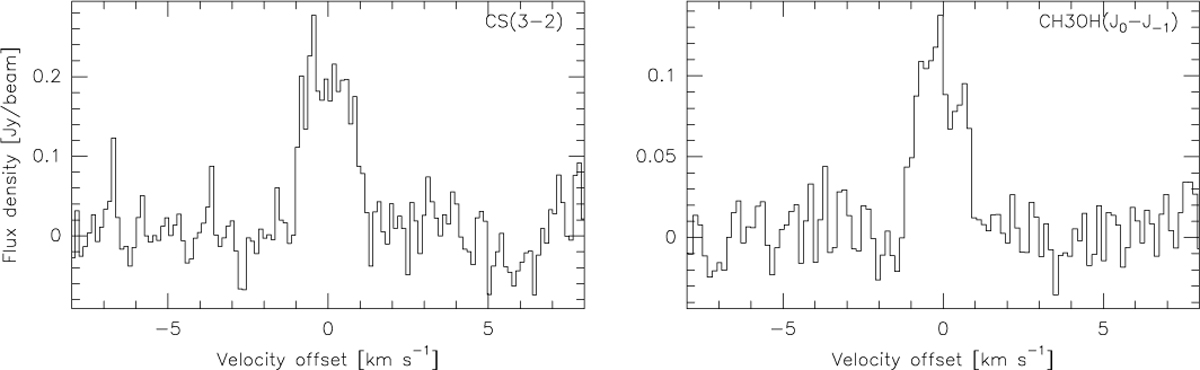
Spectra extracted at the brightness peak position of the interferometric maps. The CS (J = 3–2) line is presented in the left panel while the sum of seven methanol lines (J0 – J−1E, J = 2, 3, 4, 5, 6, 7, 8) is displayed in the right panel. The vertical scale is the flux in Jy per beam and the horizontal scale is the Doppler velocity in the comet rest frame.
Current usage metrics show cumulative count of Article Views (full-text article views including HTML views, PDF and ePub downloads, according to the available data) and Abstracts Views on Vision4Press platform.
Data correspond to usage on the plateform after 2015. The current usage metrics is available 48-96 hours after online publication and is updated daily on week days.
Initial download of the metrics may take a while.