Fig. 13
Download original image
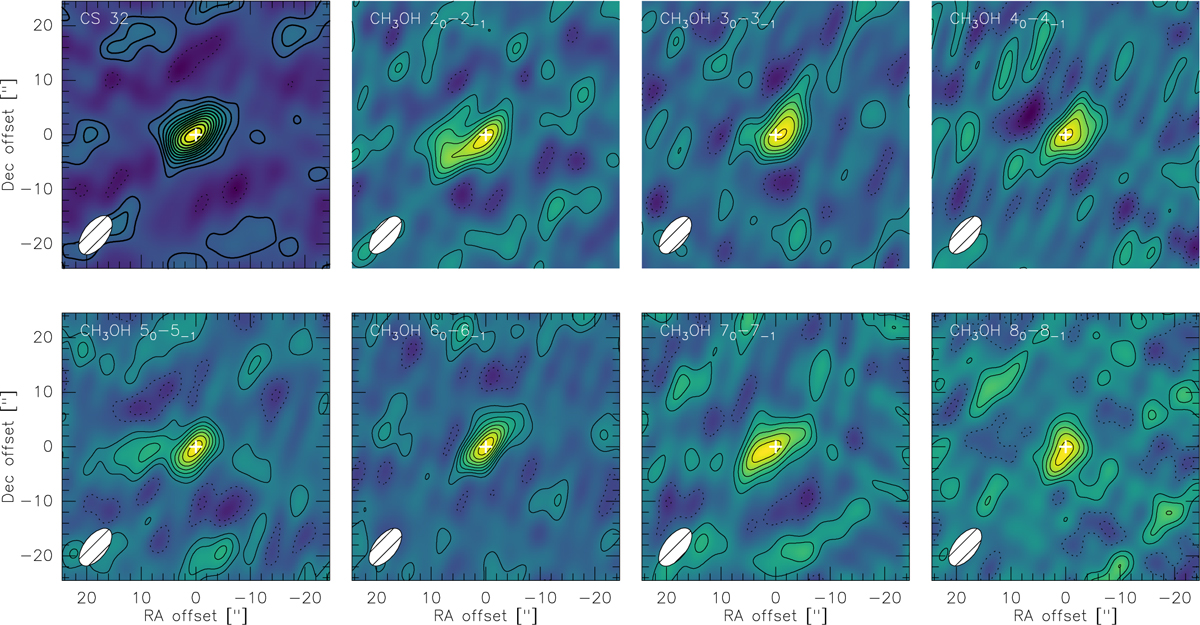
Interferometric maps of the CS J = 3-2 and for each methanol J0 − J−1 E line (J = 2, 3, 4, 5, 6, 7, 8) as observed with NOEMA on 22 July 2020. The synthesised beam is shown on the bottom left corner. The maps were recentered on the brightness peak position (as found by fitting a point source to the visibility distribution). Contour intervals are 1 × σ, σ being the map rms (0.028 Jy km s−1 for CS J(3–2), and 0.036, 0.032, 0.038, 0.040, 0.032, 0.038, and 0.036 Jy km s−1 for the methanol J0 − J−1E lines, with J = 2, 3, 4, 5, 6, 7, and 8, respectively.
Current usage metrics show cumulative count of Article Views (full-text article views including HTML views, PDF and ePub downloads, according to the available data) and Abstracts Views on Vision4Press platform.
Data correspond to usage on the plateform after 2015. The current usage metrics is available 48-96 hours after online publication and is updated daily on week days.
Initial download of the metrics may take a while.