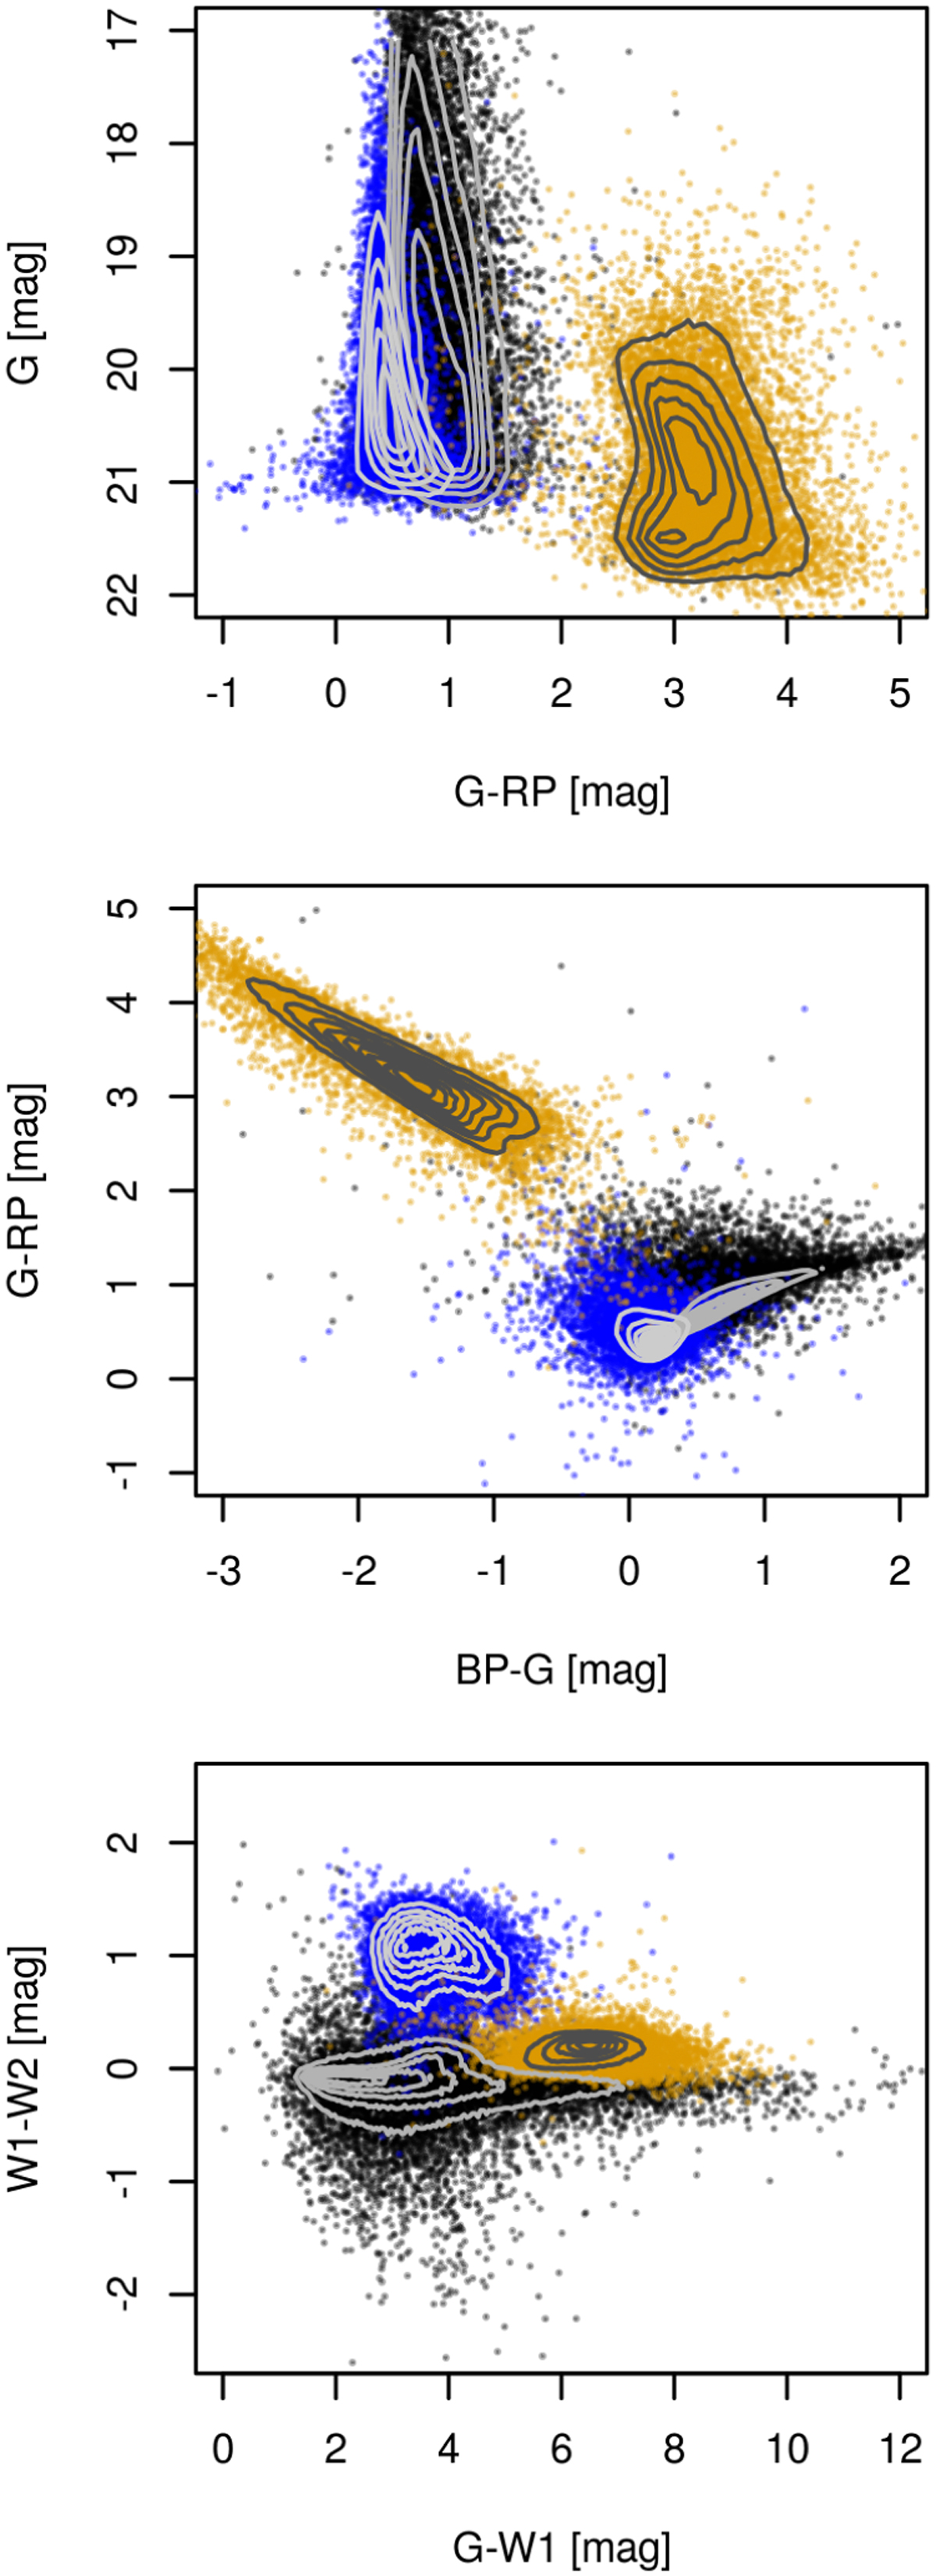
Fig. 3
Download original image
Colour-magnitude diagram (top) and two colour-colour (middle αnd bottom) diagrams highlighting the distribution of each class, with contours designating the density on a linear-scale for a random sample of 10 000 observations. The colour black corresponds to stars, blue to quasars, and gold to galaxies. Distinct aggregates can be identified for each class, although a significant interclass overlap still occurs.
Current usage metrics show cumulative count of Article Views (full-text article views including HTML views, PDF and ePub downloads, according to the available data) and Abstracts Views on Vision4Press platform.
Data correspond to usage on the plateform after 2015. The current usage metrics is available 48-96 hours after online publication and is updated daily on week days.
Initial download of the metrics may take a while.