Fig. 22
Download original image
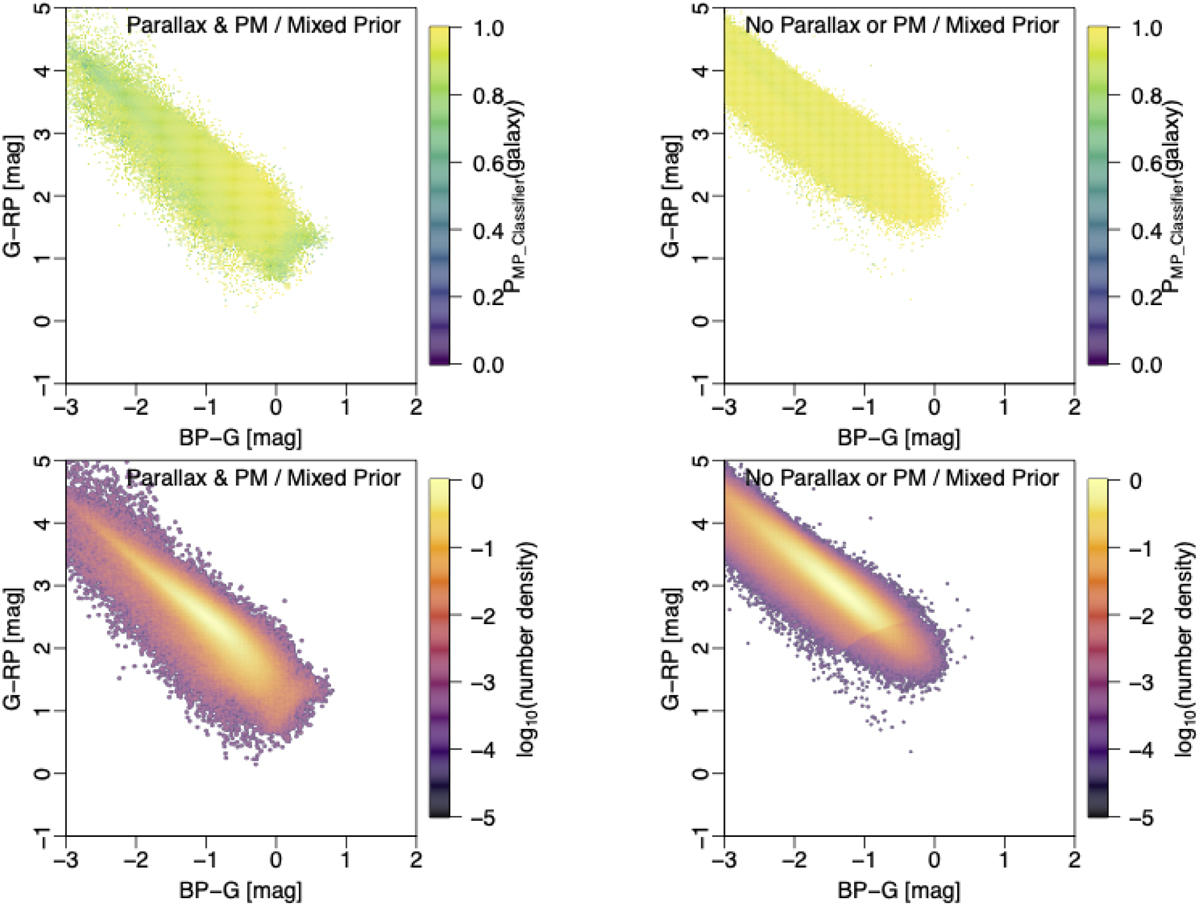
GDR3 Galaxy candidate table mixed prior: probability and density distributions for sources classified as a galaxy The right hαnd side pαnels correspond to sources with parallax while the left hand side panels represent the distribution for sources without parallax. We find in the bottom-right panel a similar colour excess factor locus at BP-G =−0.5 and G-RP = 2, as in Fig. 3 of Bailer-Jones et al. (2019) and Fig. 31 of Gaia Collaboration (2022a). This locus is however not evident in the case which has parallax and proper motions.
Current usage metrics show cumulative count of Article Views (full-text article views including HTML views, PDF and ePub downloads, according to the available data) and Abstracts Views on Vision4Press platform.
Data correspond to usage on the plateform after 2015. The current usage metrics is available 48-96 hours after online publication and is updated daily on week days.
Initial download of the metrics may take a while.