Fig. 14
Download original image
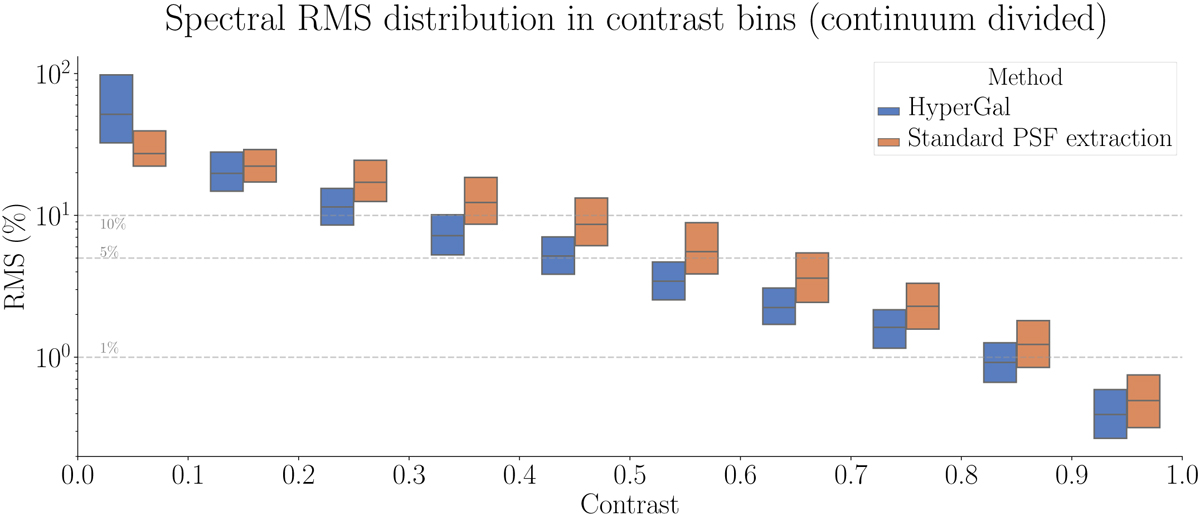
Distribution, as a function of the contrast, of the spectral relative rms between simulation input spectra and extracted spectra, averaged over the [4000, 8000] Å domain. In the boxes, the 3 levels represent the 3 quartiles (25%, median, and 75%). Each bin includes the same number of simulations, as the contrast c is uniformly distributed in [0, 1].
Current usage metrics show cumulative count of Article Views (full-text article views including HTML views, PDF and ePub downloads, according to the available data) and Abstracts Views on Vision4Press platform.
Data correspond to usage on the plateform after 2015. The current usage metrics is available 48-96 hours after online publication and is updated daily on week days.
Initial download of the metrics may take a while.