Fig. 13
Download original image
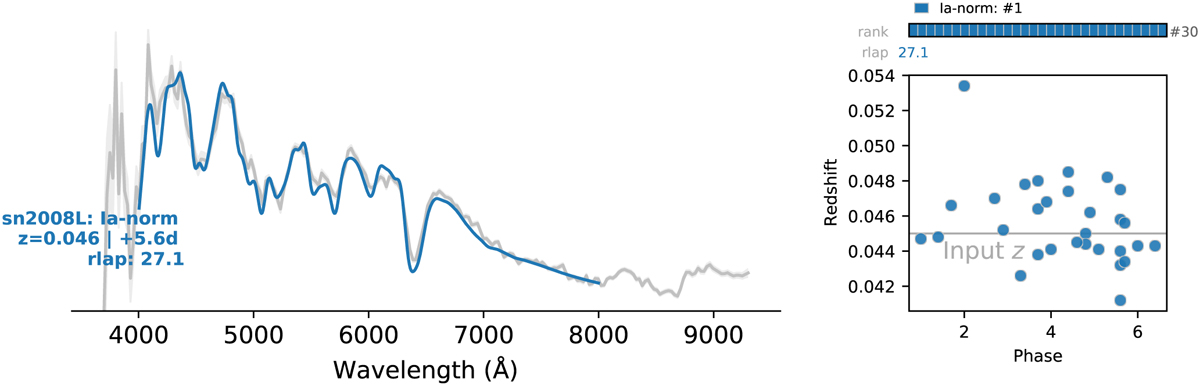
snid typing of the ZTF20aamifit HyperGal spectrum. Left panel: input spectrum (in grey) and best model from snid (in blue). Right panel: distribution in the (redshift, phase) plane of the 30 best matches with an rlap > 5 (all being normal SNe la in this case). The input redshift of the galaxy (z = 0.045) is indicated with the horizontal grey line. The best model, with a very high rlap = 27, classifies ZTF20aamiflt as an SN la at redshift z = 0.046 and phase p = +5.6 days.
Current usage metrics show cumulative count of Article Views (full-text article views including HTML views, PDF and ePub downloads, according to the available data) and Abstracts Views on Vision4Press platform.
Data correspond to usage on the plateform after 2015. The current usage metrics is available 48-96 hours after online publication and is updated daily on week days.
Initial download of the metrics may take a while.