Fig. 12
Download original image
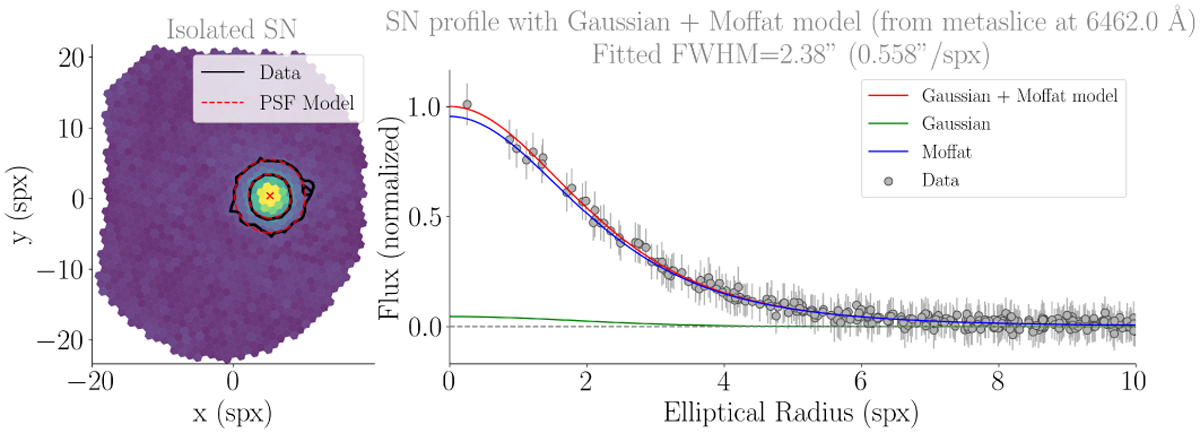
SN ZTF20aamifit, isolated from the SEDM data cube. Left panel: isolated SN component in the SEDM [6167, 6755] Å metaslice, after subtraction of both the host and background models; the red cross indicates the fitted SN location, and contours show the elliptical isoradius at 3 and 5 spx for observations (black solid lines) and model (red dashed lines). Right panel: PSF profile for the same metaslice, as a function of the elliptical radius. The data points refer to the isolated SN on the left panel, the red curve corresponds to the PSF profile (without the background), the blue and the green curves to the Moffat and the Gaussian components, respectively. The Gaussian component is particularly weak because of the poor seeing conditions.
Current usage metrics show cumulative count of Article Views (full-text article views including HTML views, PDF and ePub downloads, according to the available data) and Abstracts Views on Vision4Press platform.
Data correspond to usage on the plateform after 2015. The current usage metrics is available 48-96 hours after online publication and is updated daily on week days.
Initial download of the metrics may take a while.