Fig. 8.
Download original image
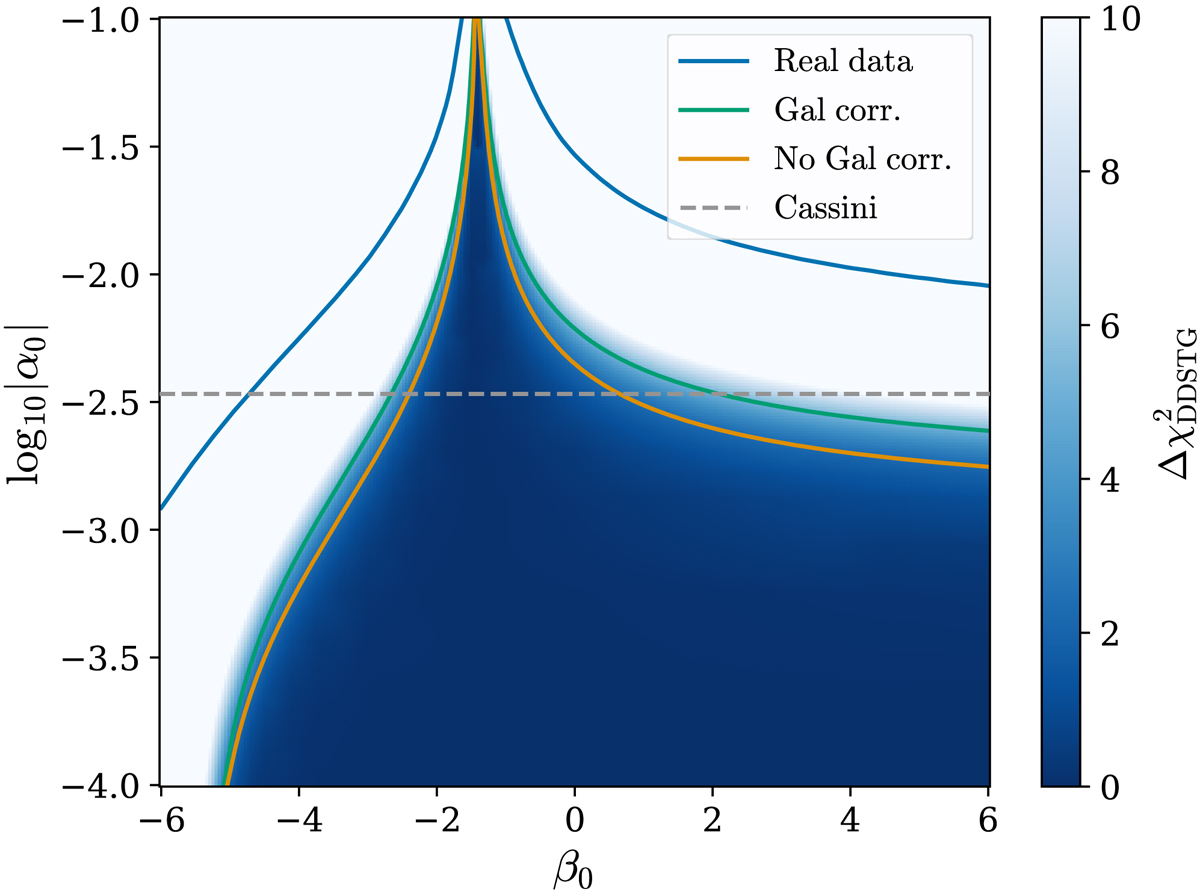
Δχ2 map in DEF gravity space {α0, β0} for the simulated dataset (2023–2032) with four campaigns every year. The tests are performed using the DDSTG timing model and assuming stiff MPA1 EOS. The solid lines correspond to the 68% C.L. limits (Δχ2 ≃ 2.28). The limit with the blue line is based on the existing TOAs. The blue shade and the orange line are the results for the simulated TOAs that do not account for the Galactic uncertainty in Ṗb,xs. The green line shows the corrected limit, with Ṗb,xs taken at its 1σ limit. The dashed grey line is the limit from the Solar System Cassini experiment (![]() ).
).
Current usage metrics show cumulative count of Article Views (full-text article views including HTML views, PDF and ePub downloads, according to the available data) and Abstracts Views on Vision4Press platform.
Data correspond to usage on the plateform after 2015. The current usage metrics is available 48-96 hours after online publication and is updated daily on week days.
Initial download of the metrics may take a while.